
With stock markets falling or rising by 5 or even 10% a day just lately, it’s practically impossible to predict the direction of markets in the very short term. In the long term, as TEBI readers know, the picture is usually positive. But what about the short-to-medium-term? Some commentators claim that dispersion and correlation levels may at least provide a clue.
Dispersion and correlation are sometimes regarded, mistakenly, as the same thing. But they’re subtly different. DISPERSION is the difference between the best and worst performers in an index of securities. CORRELATION is a measure of how much any two securities move in the same direction.
CRAIG LAZZARA is Managing Director and Global Head of Index Investment Strategy at S&P Dow Jones Indices. He has been studying dispersion and correlation levels in the S&P 500. In his latest guest post, Craig explains why he believes current correlation levels are particularly worthy of attention.
Mea culpa: Roughly a month ago I used a dispersion-correlation map to describe how index dynamics can illuminate market movements. In particular, I reported that since high dispersion seems to be a necessary condition for a bear market, and S&P 500 dispersion levels at the end of February were far below those prevailing in past declines, conditions at that time did not look like bear markets had historically looked.
Since our analysis uses a 21 trading day look-back, I providentially noted that “in 21 more days we’ll have a completely new set of observations”. 21 days have now passed, and we have a completely new set of observations.
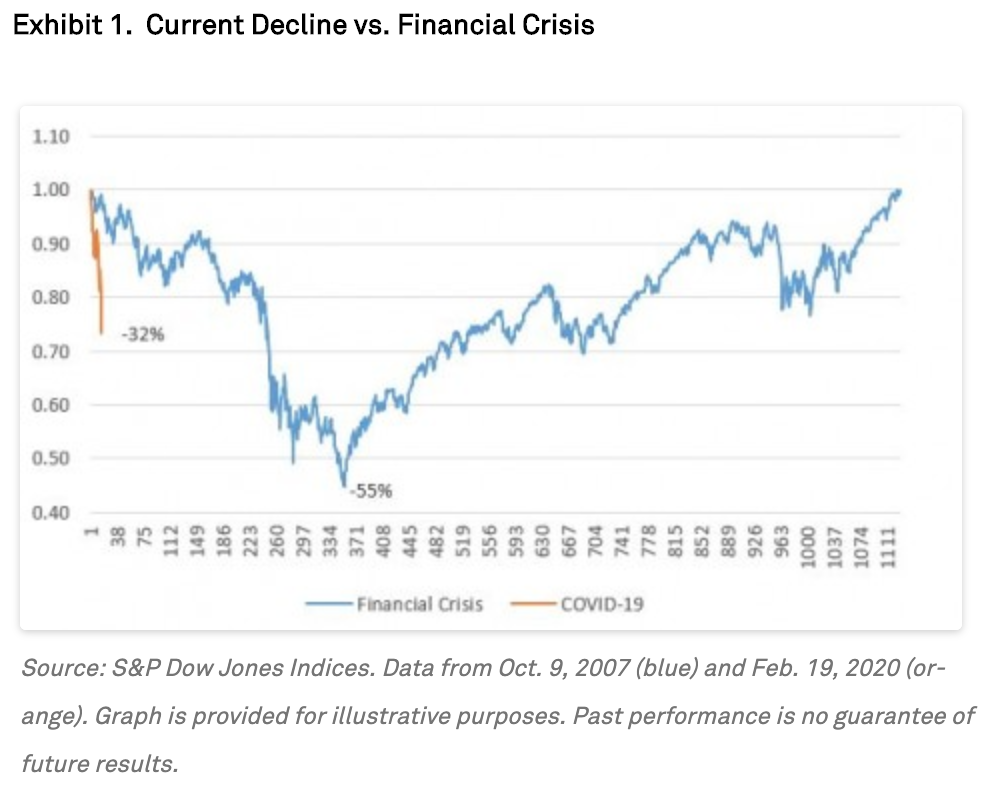
Market dynamics have evolved with extraordinary speed, as any sentient observer knows. Exhibit 1 shows the decline in the S&P 500 since its February 19th high, plotted against comparable data from the 2007-09 financial crisis. The index declined 32% from its peak through to the close of trading on March 20, 2020. The comparable loss of value during the financial crisis required a full year.
Just as values deteriorated rapidly, dispersion and correlation shifted rapidly. Exhibit 2 plots 21-day trailing dispersion and correlation between February 19 and March 20. The movement toward higher dispersion and higher correlation — upward and to the right — is striking. Bear markets seem less dependent on correlation than on dispersion, and dispersion has increased dramatically. But what’s particularly striking is today’s elevated level of correlation.
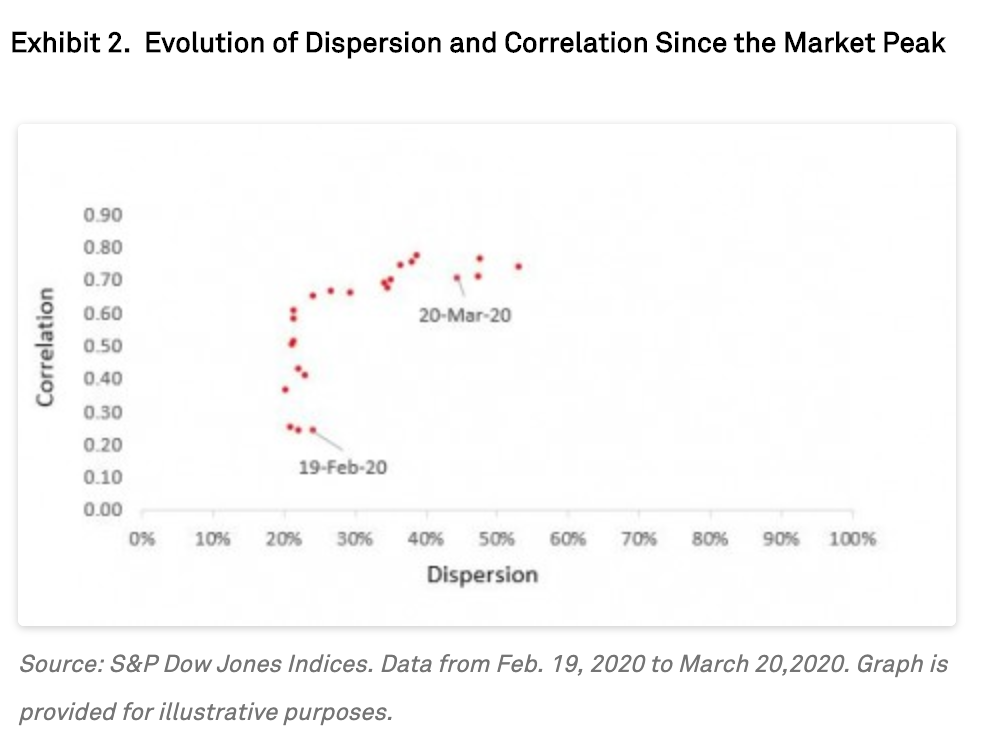
This makes fundamental economic sense, of course, since correlation measures the degree to which the components of the index move together. A pandemic of still-unknown duration and severity can be expected to affect every business adversely. The degree of adversity will obviously vary across industries, with some (e.g. airlines and hotels) suffering more than others (which accounts for heightened dispersion). But almost all will move down, driving correlations higher.
Exhibit 3 makes it clear that this has happened to an unprecedented degree, as correlations within the S&P 500 reached record levels for the month ended March 20. Students of index dynamics will not be surprised: high volatility can be expected when both dispersion and correlation are elevated. It is hard, in fact, to find other months comparable to this one; Exhibit 3 highlights those closest to today in the upper right corner.
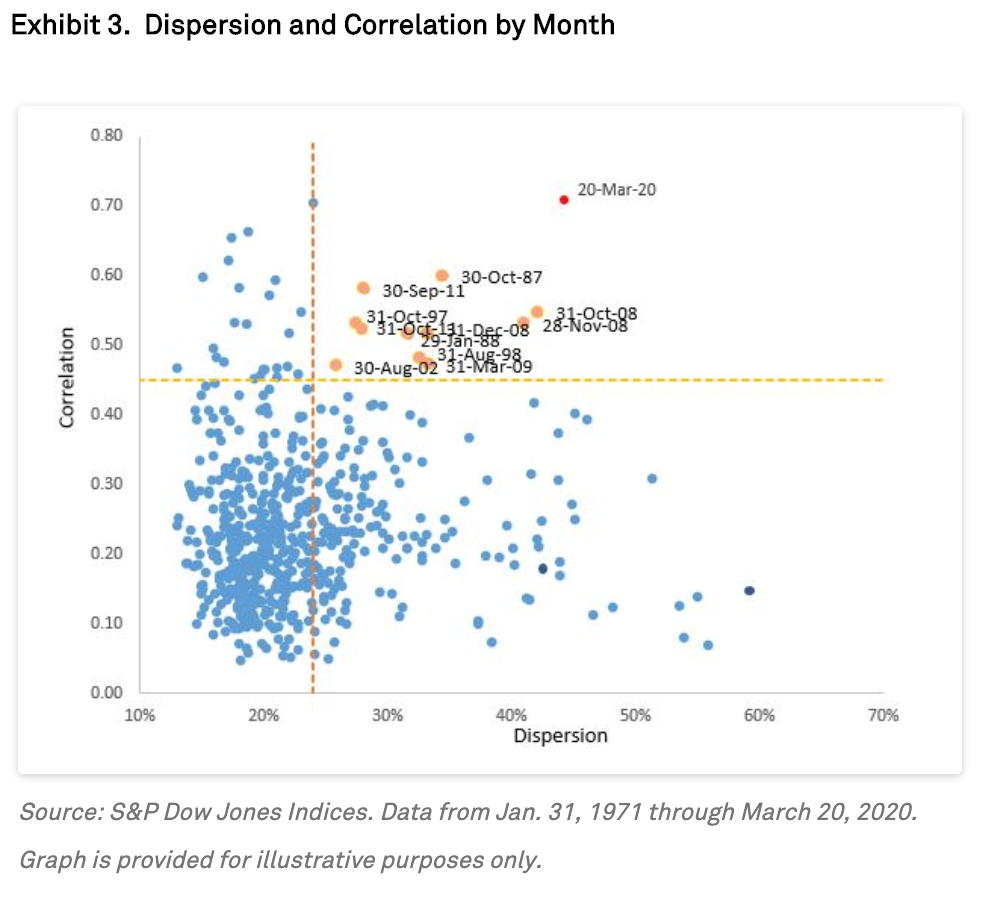
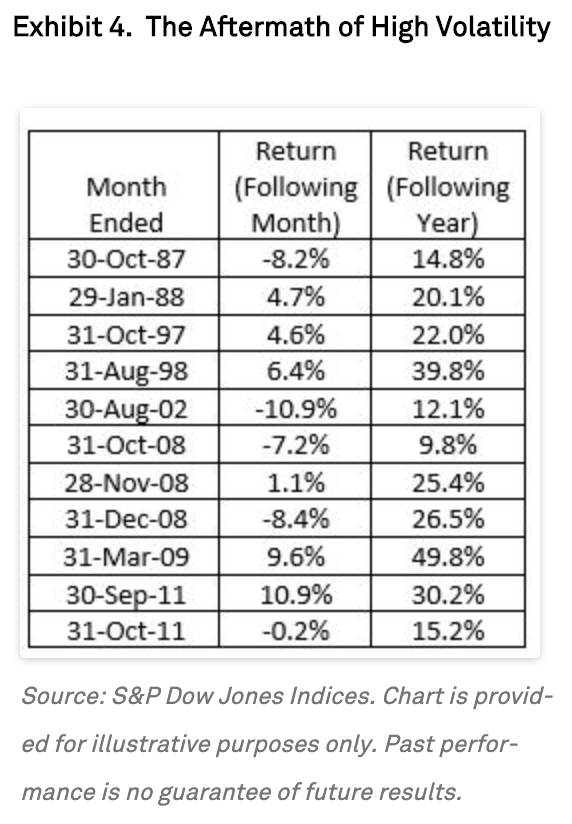
Exhibit 4 identifies each month in which dispersion was above average and correlation was elevated (above 0.45), and asks what happened in the aftermath of the market’s reaching those levels. There have been 11 such months since 1971; in every case the market was higher a year later, with an average gain of 24%.
Past results legendarily do not predict future returns, and today’s correlation levels suggest that more spikes in volatility might lie ahead. But selling stocks in environments like the present has historically meant missing out on the recovery.
This article was first published on the Indexology blog and is republished here with permission.
Also by Craig Lazzara:
Does passive investing encourage companies to collude?
A new way of looking at indexing
Are passive managers really kings of Wall Street?
Fund performance jiggery pokery
Picture: Ussama Azam via Unsplash