Study sheds light on why hedge funds are struggling
Comments Off on Study sheds light on why hedge funds are struggling
By LARRY SWEDROE
In his book Winning the Loser’s Game, Charles Ellis presented evidence that while it’s possible to generate alpha (risk-adjusted outperformance) and win the game of active management (individual security selection and/or market timing), the odds of doing so are so poor it’s not prudent to try.
The surest way to win a loser’s game — like craps and roulette in casinos — is to choose not to play. In investing, that means using passively managed funds (funds that don’t engage in individual security selection and/or market timing and use systematic approaches to implementation) such as index funds.
In our 2015 book The Incredible Shrinking Alpha, Andrew Berkin and I laid out the case for why generating alpha has become persistently more difficult. We discussed four big themes:
- Academic research has been converting what was once alpha into beta (exposure to a common factor), which can be obtained less expensively through vehicles such as index funds, factor-based exchange-traded funds (ETFs), and other passively managed factor-based mutual funds that are not pure index funds. For example, before 1993 active managers could claim alpha simply by owning small and/or value stocks. Today that’s considered exposure to a common factor (or beta), not alpha.
- The competition has been getting tougher. Those managing money today have much stronger academic backgrounds than their predecessors.
- The pool of victims that can be exploited has been shrinking as “dumb” retail money abandons the game of individual stock selection. Today about 90 percent of all trading is done by institutional investors.
- The number of dollars chasing the shrinking pool of available alpha has dramatically increased.
New evidence
Rodney Sullivan’s December 2019 paper Hedge Fund Alpha: Cycle or Sunset? provides further support for the thesis that alpha is becoming increasingly harder to generate. Sullivan examined the performance of hedge funds over the period 1994 through June 2019. He created a hedge fund composite using the monthly after-fee returns of the overall Credit Suisse Hedge Fund Index and the HFRI Fund Weighted Composite Index (weighted 50/50). Over this period, hedge fund assets grew from just a few hundred billion dollars to in excess of $3 trillion.
Sullivan began by noting that it’s a mistake to compare the performance of hedge funds to an all-equity benchmark because many hedge funds use alternative strategies. To address this issue, he used regression analysis and found that on average hedge funds had exposure to market beta (S&P 500 Index) of 0.37 and exposure to bond market beta (Bloomberg/Barclays U.S. Aggregate Bond Index) of 0.14. Following is a summary of his findings. All results are net of fees:
- The simple two-factor model explained about 70 percent of the variation in returns.
- The average alpha was 1.7 percent per year over the full period.
- The ability to generate alpha declined sharply post 2008.
- Beginning in 2008, we observe a low to negative rolling one-year alpha, with negative rolling 12-month performance over the latter part of the most recent decade. The three-year rolling alpha makes this downward trend even more evident, with mostly small negative alpha for hedge funds over the prior 36 months since the beginning of 2013.
- For the period beginning in 2009, the annual alpha was -0.8 percent.
- Similar results were found when focusing on equity hedge fund managers.
The impact on investors is much worse than it appears because, while hedge funds generated alpha of 1.7 percent a year over the full period, the strong results occurred while assets under management were relatively small. Those strong results led to a dramatic increase in cash flows as investors wanted “in on the game”.
Sullivan asset-weighted the returns and found that over the full period, on a risk-adjusted basis, hedge funds had destroyed more than $21 billion. However, due to the increase in assets (to $3.1 trillion) over the last 12 months alone, they had destroyed over $40 billion on a risk-adjusted basis. And alpha has been persistently negative since 2008. Just think about how much has been lost in the quest for alpha.
Exposure to different risk factors
Sullivan next analysed the performance of the hedge funds taking into account their exposures to the leading common factors identified in the literature. He specifically looked at size, value, cross-sectional momentum, quality, time-series momentum (trend following), and equity volatility (selling both a put and a call with the same strike price). He noted that each of the factors had low correlation to stocks and negative correlations to each other (they are unlikely to be redundant). Scaling each of the factors to a volatility of 10 percent, he found:
- His nine-factor model helped to better understand the systematic drivers of hedge fund returns as a group (85 percent versus 70 percent for the two-factor stock/bond model). And its explanatory power increased from 87 percent in the pre-crisis period to 91 percent in the post-crisis period.
- In the pre-crisis period, equity hedge fund managers preferred securities that were smaller, more growth oriented (not value), had positive relative momentum, had lower quality (junkier), were long time-series momentum and equity market volatility (but not statistically so).
- In the post-crisis period, while hedge funds remained positively exposed to equities, they became negatively exposed to bonds. In addition, they still significantly preferred growth oriented (not value) and junkier (lower quality) stocks. They also reduced their exposures to small stocks, cross-sectional momentum, time-series momentum and equity volatility (exposures all became statistically insignificant).
- Alpha declined markedly for equity hedge fund managers post 2008, about 4 percentage points per year smaller versus the pre-crisis period.
An interesting and important finding was that the nine-factor model showed that in the post-crisis period, hedge funds delivered a risk-adjusted alpha of 2.3 percent (it was almost 4 percent higher in the pre-crisis period).
Unfortunately, their returns were poor because of the large negative loading (-0.81) on quality, negatively impacting their performance. During this period, the annualised quality premium was 6.1 percent. Thus, the negative loading had a negative impact of almost 5 percent on hedge fund returns.
Their negative loading on bonds (-0.3) in the post-crisis period also negatively impacted returns (-1 percent).
Further evidence
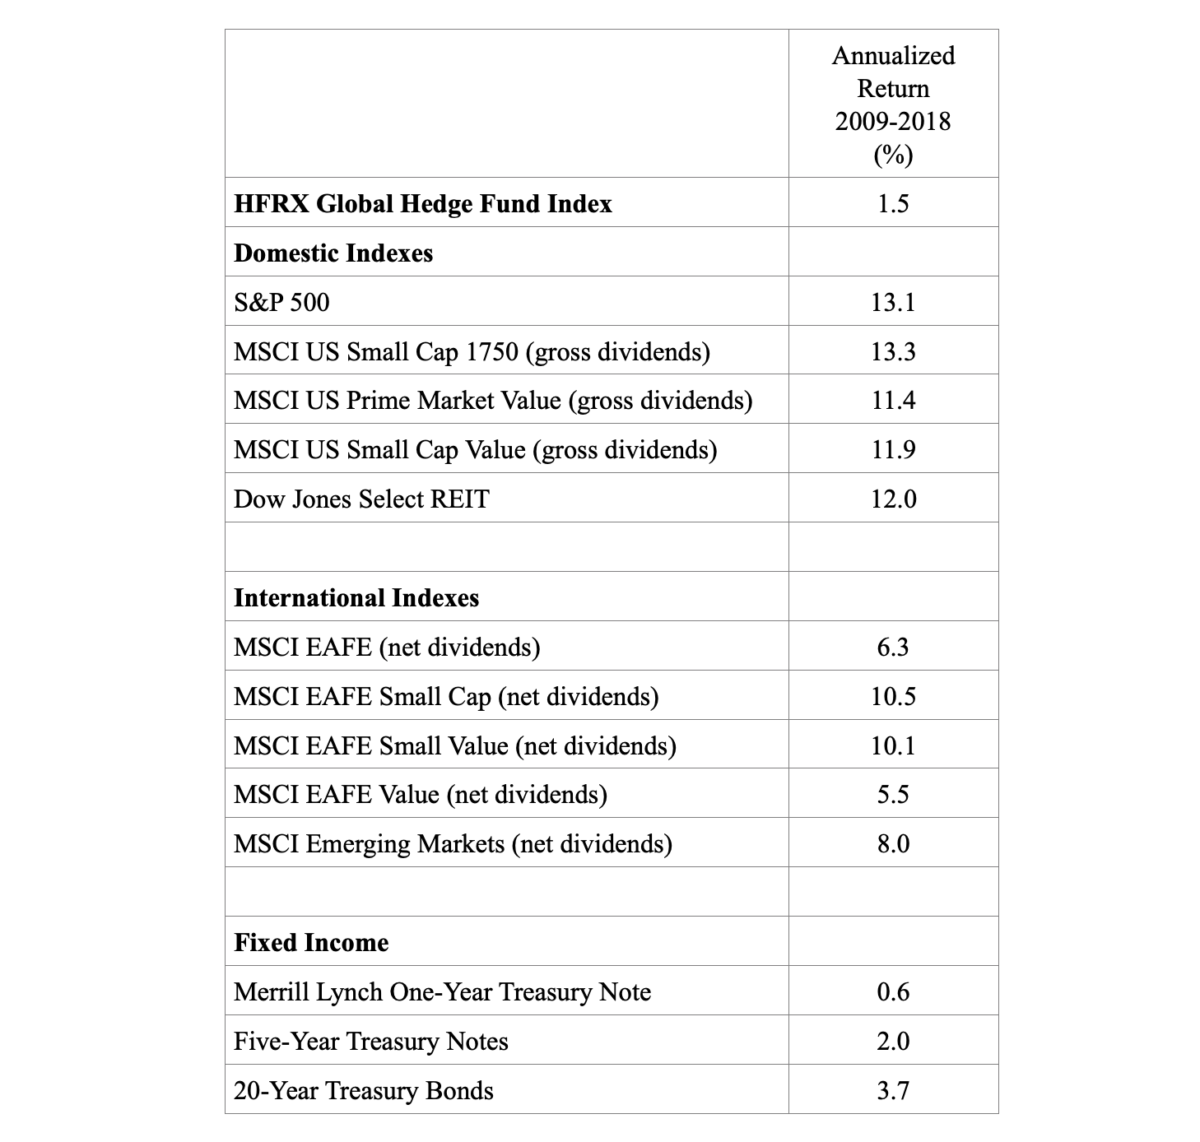
Hedge funds entered 2019 coming off their 10th straight year of trailing the return of the S&P 500 Index. And as you can see in the following table, over the 10-year period ending December 2018, they underperformed every single major equity asset class by wide margins. However, as Sullivan noted, comparing their returns to an all-equity portfolio is comparing apples to oranges. That said, you can see that they also outperformed virtually riskless one-year Treasuries by just 0.9 percentage point, and underperformed intermediate and long-term Treasuries.
The poor performance of hedge funds continued through the first three quarters of 2019:
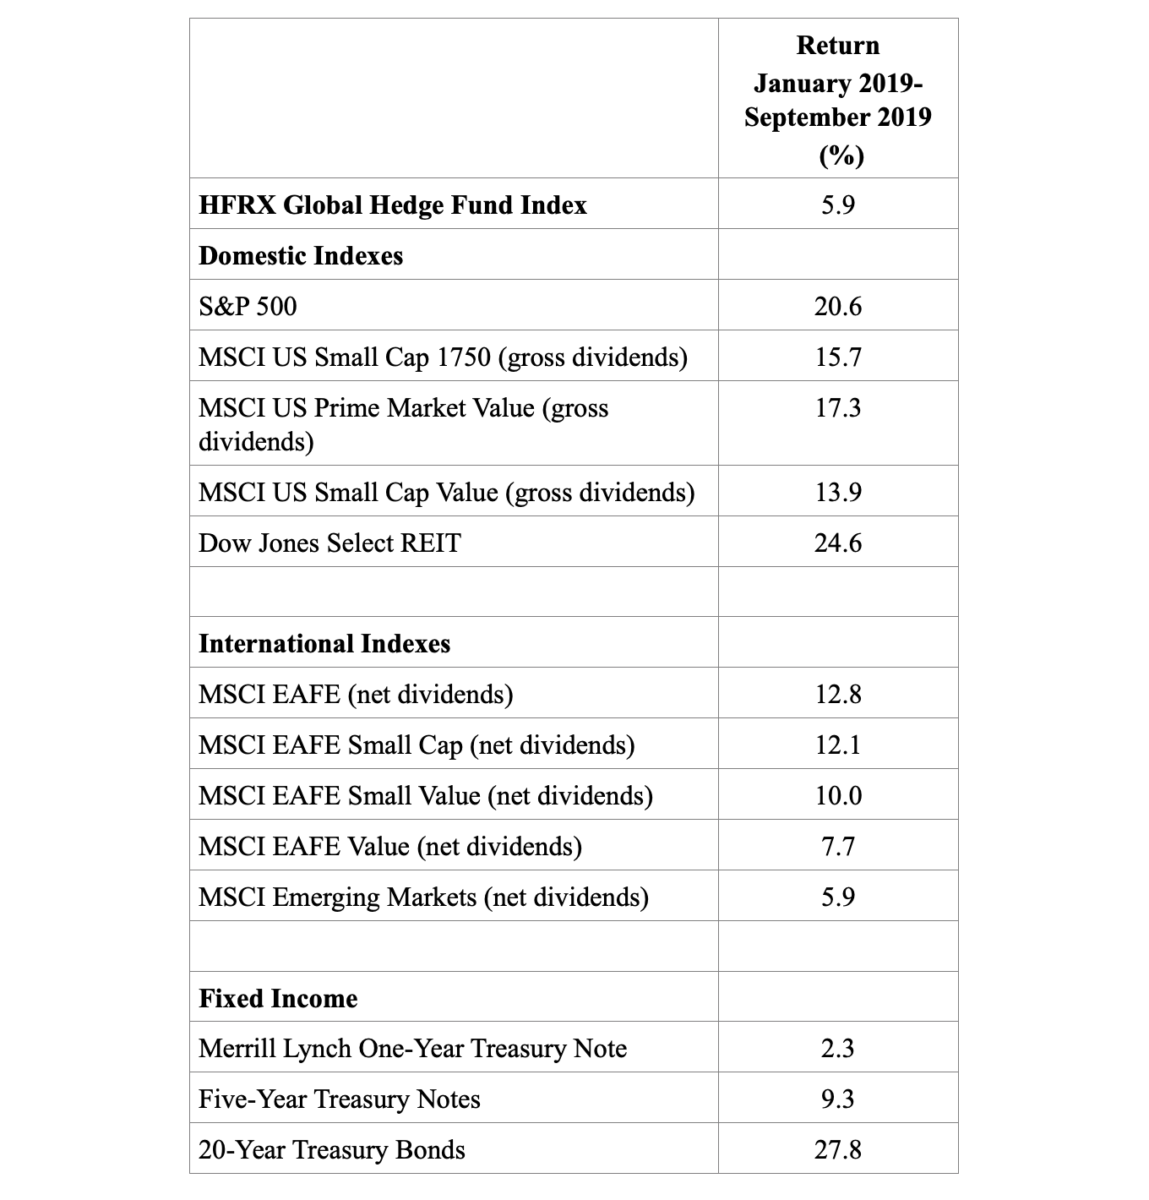
As you can see, the hedge fund index underperformed every single major equity asset class, and two of the three bond indexes. An all-equity portfolio allocated 50 percent internationally and 50 percent domestically, equally weighted among the indexes from the table within those broader categories, would have returned 14.0 percent. In other words, it would have the hedge fund index (HFI) by 8.1 percentage points.
A more appropriate comparison is to a typical balanced portfolio of 60 percent equities and 40 percent bonds. Using the same weighting methodology as above for the equity allocation, the portfolio would have returned 9.3 percent using one-year Treasuries (outperforming the HFI by 3.4 percentage points), 12.1 percent using five-year Treasuries (outperforming the HFI by 6.2 percentage points), and 19.5 percent using long-term Treasuries (outperforming the HFI by 13.6 percentage points).
Given the results and the wide dispersion of returns between U.S. and international equities, one might think hedge funds would have used their freedom to move across asset classes, which they often tout as their big advantage, to better effect.
Summary
Sullivan’s findings help investors gain insight into the various historical drivers of performance and how these may have changed in the post-crisis period. The findings of sharply declining alphas, and poor factor selection leading to poor investor returns, beg the question of why investors continue to pour money into hedge funds.
Perhaps it’s the need to feel part of “the club” that has access to these funds. Those investors would have been better served to follow Groucho Marx’s advice: “I wouldn’t want to belong to a club that would have me as a member.”
(Full disclosure: My firm, Buckingham Strategic Wealth, recommends Bridgeway and Dimensional funds in constructing client portfolios.)
LARRY SWEDROE is Chief Research Officer at Buckingham Strategic Wealth and the author of 17 books on investing, including Think, Act, and Invest Like Warren Buffett.
Want to read more of his work? Here are his most recent articles published on TEBI:
The economy and the stock market are not the same
Will negative yields lead to increased risk-taking?
Does indexing really get you average returns?
Nine points to consider on the outlook for equities
Analysts’ earnings forecasts and the value premium
