
By CRAIG LAZZARA
Throughout this year’s market turmoil, dividend strategies have been among the most reliable sources of relative, if not absolute, performance. Through June 21, 2022, e.g., when the S&P 500 had declined -20.4% YTD, the S&P 500 High Dividend Index (roughly speaking, the 80 highest-yielding stocks in the 500) sustained a loss of only -3.7%. The S&P 500 Dividend Aristocrats, which focuses on dividend growth rather than absolute dividend levels, declined -14.0% — well behind its higher-yielding compatriot but still significantly ahead of the market as a whole.
We’ve commented before on the relative merits of dividend yield and dividend growth strategies, suggesting that their comparative performance is analogous to the shifting performance of value and growth. For nearly 15 years, as S&P 500 Growth dominated S&P 500 Value, the Dividend Aristocrats handily outperformed High Dividend. At the beginning of 2022, however, the tables turned: Value is trouncing Growth, and dividend yield is well ahead of dividend growth.
Lacking the ability to forecast the future relative performance of High Dividend and Dividend Aristocrats (or at least the ability to forecast it accurately), it’s natural to wonder about the results of combining the two strategies. Although the short-term advantage can shift between the two indices, in the long run the performance of High Dividend and Dividend Aristocrats has been comparable, and the correlation between their relative returns has typically been in the 0.6 to 0.7 range. This suggests that the indices’ co-movement, although reasonably strong, is not perfect, so that combining them might produce at least some diversification benefit. Exhibit 1 illustrates this with three sets of index combinations.
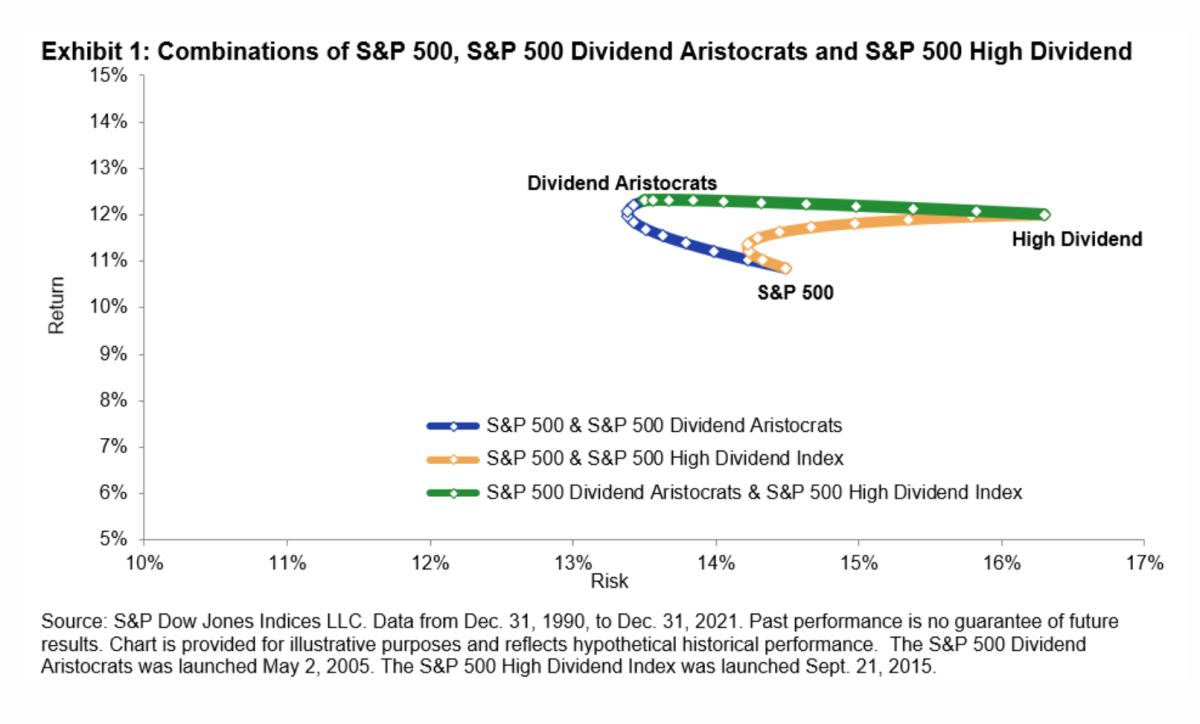
The gold curve illustrates combinations of the S&P 500 and the S&P 500 High Dividend Index. High Dividend has had both higher historical returns and higher risk than the 500, so the efficient frontier between them, after some initial curvature, moves upward and to the right, as all good efficient frontiers are wont to do.
The blue curve is more interesting; it shows combinations of the S&P 500 and the S&P 500 Dividend Aristocrats. Notice that this efficient frontier moves upward and to the left; Dividend Aristocrats historically has had higher returns and been less volatile than the S&P 500. It is, in other words, a member in good standing of the class of indices that benefit from the low volatility anomaly — the tendency of stocks with below-average volatility to outperform the market as a whole.
Most interesting of all is the green curve, which illustrates combinations of the Dividend Aristocrats and High Dividend indices. It’s interesting because it dominates both the efficient frontiers beneath it. Combinations of Dividend Aristocrats and High Dividend have provided more return for the same level of risk as combinations of either index singly with the S&P 500.
This finding implies that dividend-seeking investors need not feel pressured to choose between dividend levels and dividend growth. Combining the two strategies can potentially produce a more attractive risk/return profile than holding either in isolation.
CRAIG LAZZARA is Managing Director and Global Head of Index Investment Strategy at S&P Dow Jones Indices.
This article was first published on the Indexology blog.
MORE FROM S&P DJI
For more valuable insights from S&P Dow Jones Indices, you might like to read these other recent articles:
Is outperformance down to luck or skill?
Why have large-cap growth funds performed so badly?
2021 was third-worst year on record for US active managers
Will 2022 be a better year for active managers?
Putting value’s two-month winning streak in context
© The Evidence-Based Investor MMXXII