
The year-end 2021 instalment of the Morningstar Active/Passive Barometer has just been published, and it shows that fewer than half of active funds delivered for investors last year. So, what are the key takeaways from these latest findings? BEN JOHNSON is director of global ETF research for Morningstar and editor of Morningstar ETFInvestor.
Actively managed funds’ success rate slipped in 2021: 45% of the active funds across the 20 Morningstar Categories included in the year-end 2021 Morningstar Active/Passive Barometer both survived and outperformed their average passive peer. This marks a slight decline from 2020, when 49% of actively managed funds lived and beat their typical indexed peer.
We further analyse these findings and more in the year-end 2021 instalment of the Morningstar Active/Passive Barometer. The Active/Passive Barometer measures active fund managers’ performance relative to their passive peers. The study spans more nearly 4,000 funds that together accounted for approximately $18.7 trillion in investor assets, or about 67% of the U.S. fund market as of Dec. 31, 2021.
Here, I’ll discuss how investors might use this report to better understand the odds of picking successful active managers and how they might winnow the field to improve their chances of partnering with those most likely to do well in the future. I’ll also provide a summary of our most recent findings.
Base rates
In his book Thinking, Fast and Slow [1], Nobel Prize-winning psychologist Daniel Kahneman discusses how he stumbled upon two different approaches to forecasting while working for Israel’s Ministry of Education to write a high school textbook about judgment and decision-making. Kahneman and his longtime collaborator Amos Tversky ultimately branded these two schools of forecasting as “the inside view” and “the outside view”. The inside view is deeply personal. In constructing a forecast based on the inside view, we focus very narrowly on our own unique experiences and situation and extrapolate from there. (For example, I’m an above-average driver with a squeaky-clean driving history about to go on a short trip in fair weather. The odds of me getting in a fender bender are almost nil.) On the other hand, a forecast based on the outside view starts with a survey of the broader population and is refined based on any specifics regarding the circumstances. (Start with the odds of any driver getting in a fender bender regardless of driving history, the distance traveled, or weather conditions, and go from there.) The outside view is anchored to a base rate. Kahneman explains the concept of base rates in Thinking, Fast and Slow:
“… It provided a reasonable basis for a baseline prediction: The prediction you make about a case if you know nothing except the category to which it belongs. This should be the anchor for further adjustments. If you are asked to guess the height of a woman and all you know is that she lives in New York City, for example, your baseline prediction is your best guess of the average height of women in the city. If you are now given case-specific information–that the woman’s son is the starting center of his high school basketball team–you will adjust your estimate.”
Depending on the problem at hand, starting from the outside and working in may be a recipe for better predictions and, thus, better decisions. I would argue that this approach has a multitude of applications within the realm of investing. I’ll share with you some base-rate data that is specific to success rates among active fund managers, and how investors can work from the outside to begin to zero in on winners.
Morningstar Active/Passive Barometer’s unique approach to measuring performance
The Morningstar Active/Passive Barometer is a semiannual report that measures the performance of U.S. active managers against their passive peers within their respective categories. The Active/Passive Barometer report is unique in the way it measures active managers’ success relative to the actual, net-of-fee performance of passive funds rather than an index, which isn’t investable.
The central question the report seeks to answer is: If an investor were to select an actively managed fund at random from a category, what are the odds that fund will survive and outperform its passive peers in any given time period?
We measure active managers’ success relative to investable passive alternatives in the same category. For example, an active manager in the U.S. large-blend category is measured against a composite of the performance of its index mutual fund and exchange-traded fund peers (Vanguard Total Stock Market Index (VTSMX), SPDR S&P 500 ETF (SPY), and so on). Specifically, we calculate the equal- and asset-weighted performance of the cohort of index-tracking (“passive”) options in each category that we examine, and we use that figure as the hurdle that defines success or failure for the active funds in the same category. The magnitude of outperformance or underperformance does not influence the success rate. However, these data are reflected in the average return figures for the funds in each group and the distribution of 10-year excess returns for surviving active funds, which we report separately.
We believe this is a better benchmark because it reflects the performance of actual investable options and not an index. Indexes are not directly investable. Their performance does not account for the real costs associated with replicating their performance and packaging and distributing them in an investable format. In addition, the success rate for active managers can vary depending on one’s choice of benchmark. For example, the rate of success among U.S. large-blend managers may vary depending on whether one uses the S&P 500 or the Russell 1000 Index as their basis for comparison. By using a composite of investable alternatives within funds’ relevant categories as our benchmark, we account for the frictions involved in index investing (such as fees), and we mitigate the effects that might stem from cherry-picking a single index as a benchmark. The net result is a fairer comparison of how investors in actively managed funds have fared relative to those who opted for a passive approach.
We measure each fund’s performance based on the asset-weighted average performance of all its share classes in calculating success rates. This approach reflects the experience of the average dollar invested in each fund. We then rank these composite fund returns from highest to lowest and count the number of funds whose returns exceed the equal-weighted average of the passive funds in the category. The success rates are defined as the ratio of the number of active funds that both survived and outperformed the average of their passive peers to the number of funds that existed at the beginning of the period. Given this unique approach, our field of study is narrower than others’, as the universe of categories that contained a sufficient set of investable index-tracking funds was fairly narrow at the end of 2011, the starting point for our latest study. The number of categories we include in this study has expanded over time and will continue to grow.
We also cut categories along the lines of cost. Cost matters. Fees are the one of the best predictors of future fund performance. We have sliced our universe into fee quintiles to highlight this relationship.
A few pictures are worth thousands of words
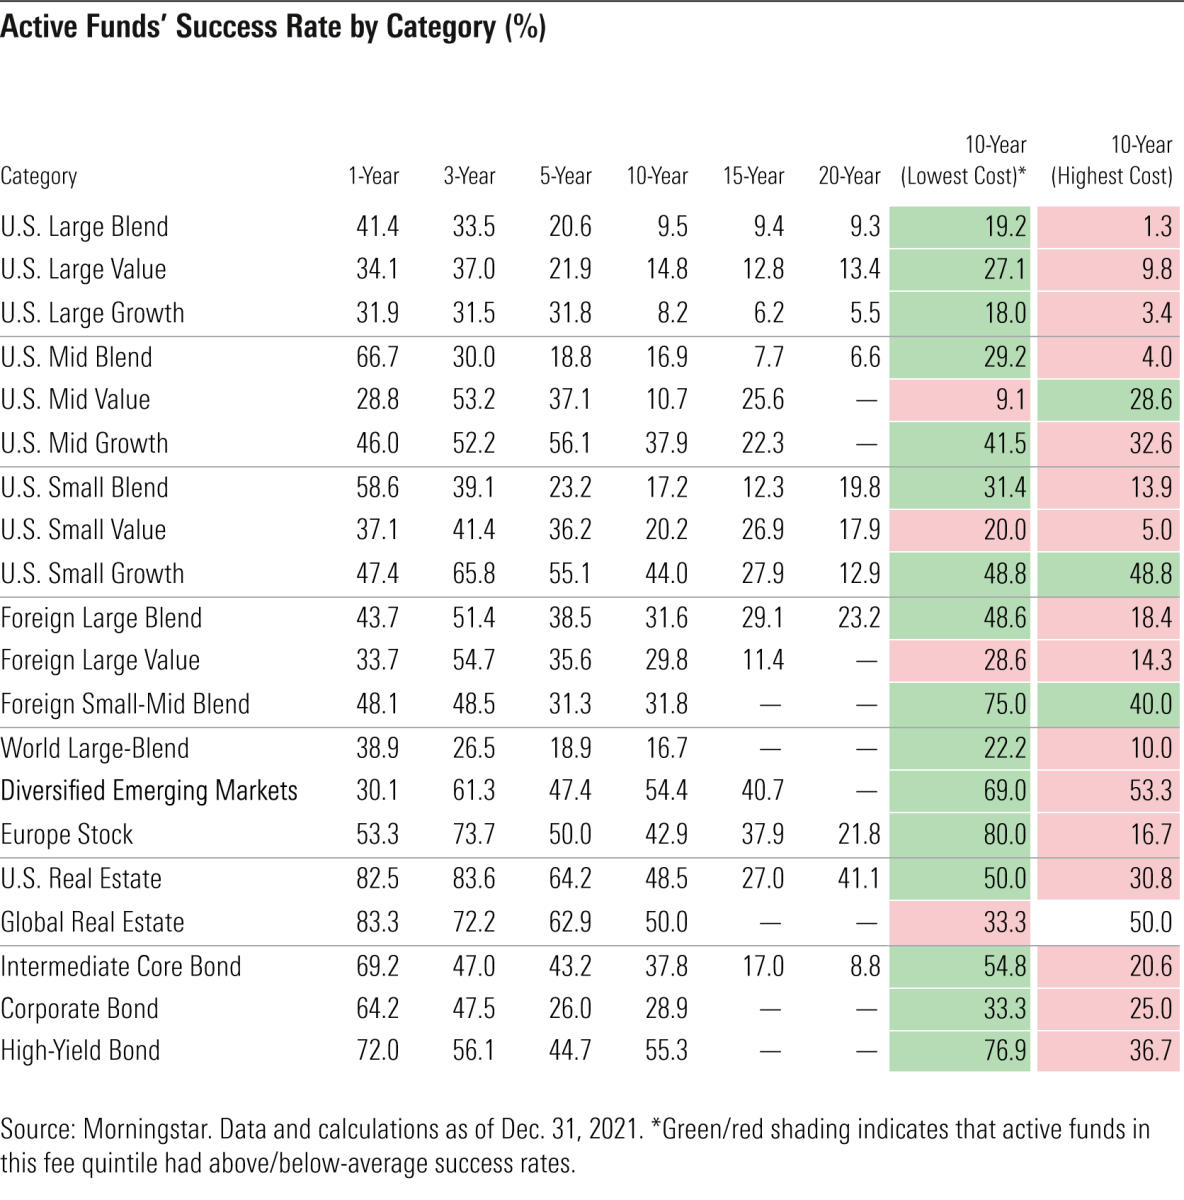
As is apparent in Exhibit 1, actively managed funds have generally underperformed their passive counterparts, especially over longer time horizons. In addition, we found that failure tended to be positively correlated with fees (that is, higher-cost funds were more likely to underperform or be shuttered or merged away, and lower-cost funds were likelier to survive and enjoyed greater odds of success). Again, fees matter. They are one of the only reliable predictors of success.
In general, actively managed funds have failed to survive and beat their average passive peer, especially over longer time horizons. Only 26% of all active funds topped the average of their passive rivals over the 10-year period ended December 2021. Long-term success rates were generally higher among foreign-stock, real estate, and bond funds and lowest among U.S. large-cap funds.
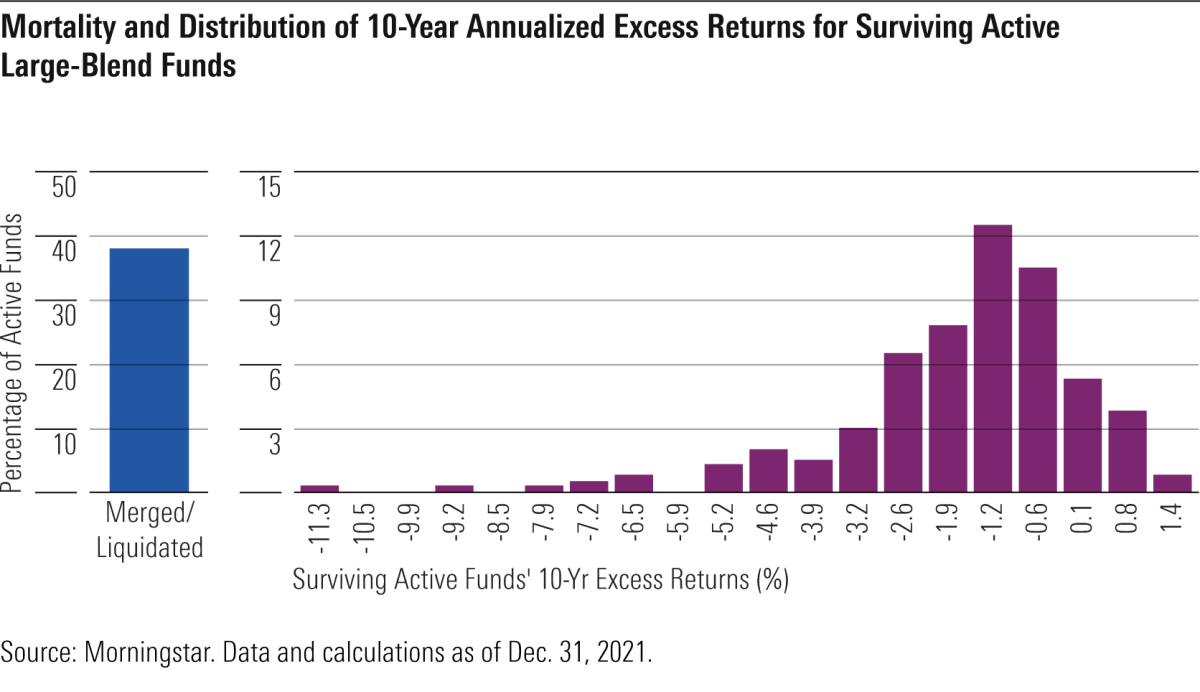
In combination with success rates and fee sorts, the distribution of active funds’ excess returns can help investors decide where best to allocate their active risk budget. This data can help to size the potential payout or penalty to manager selection. For example, the U.S. large-blend category hasn’t been favorable for stock-pickers. The long-term odds of choosing a successful active manager in this category are low. The potential payout from partnering with a winner isn’t particularly compelling. Exhibit 2 shows the distribution of excess returns among surviving active large-blend funds for the decade through December 2021. The negative skew shows that the cost of picking an unsuccessful manager was generally greater than the gains associated with one that succeeded over this span.
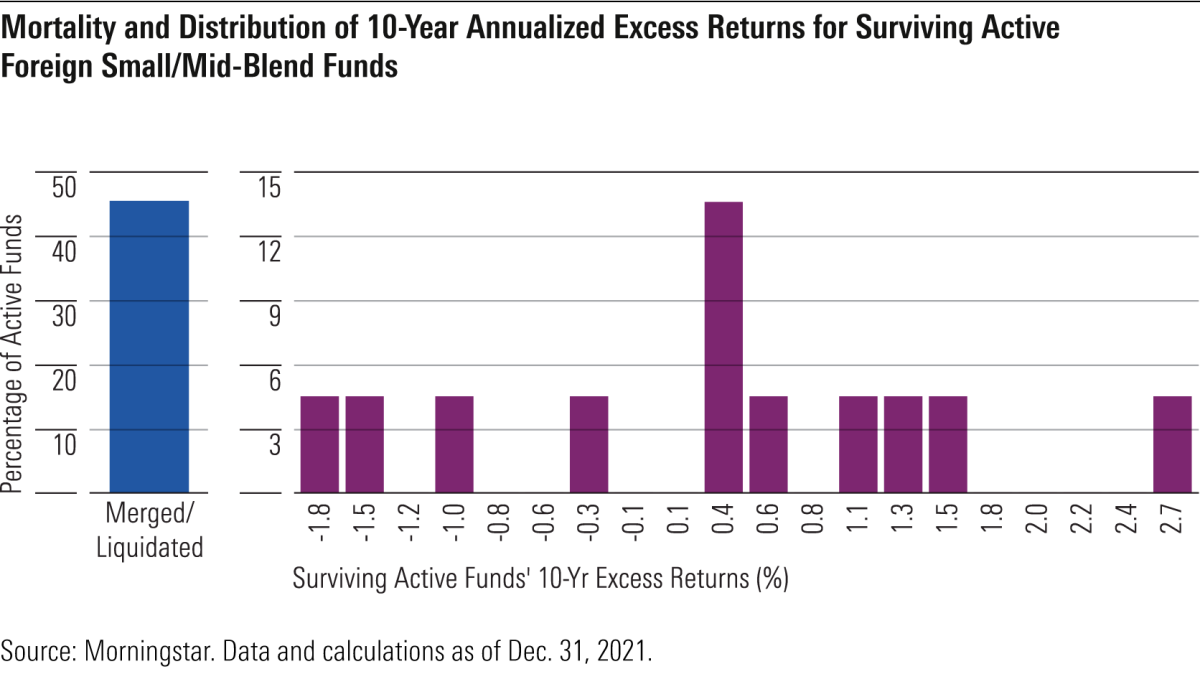
The counter example to the U.S. large-blend category is the foreign small/mid-blend category. In this case, the distribution of excess returns among surviving active managers skews positive–a much more favorable payout profile.
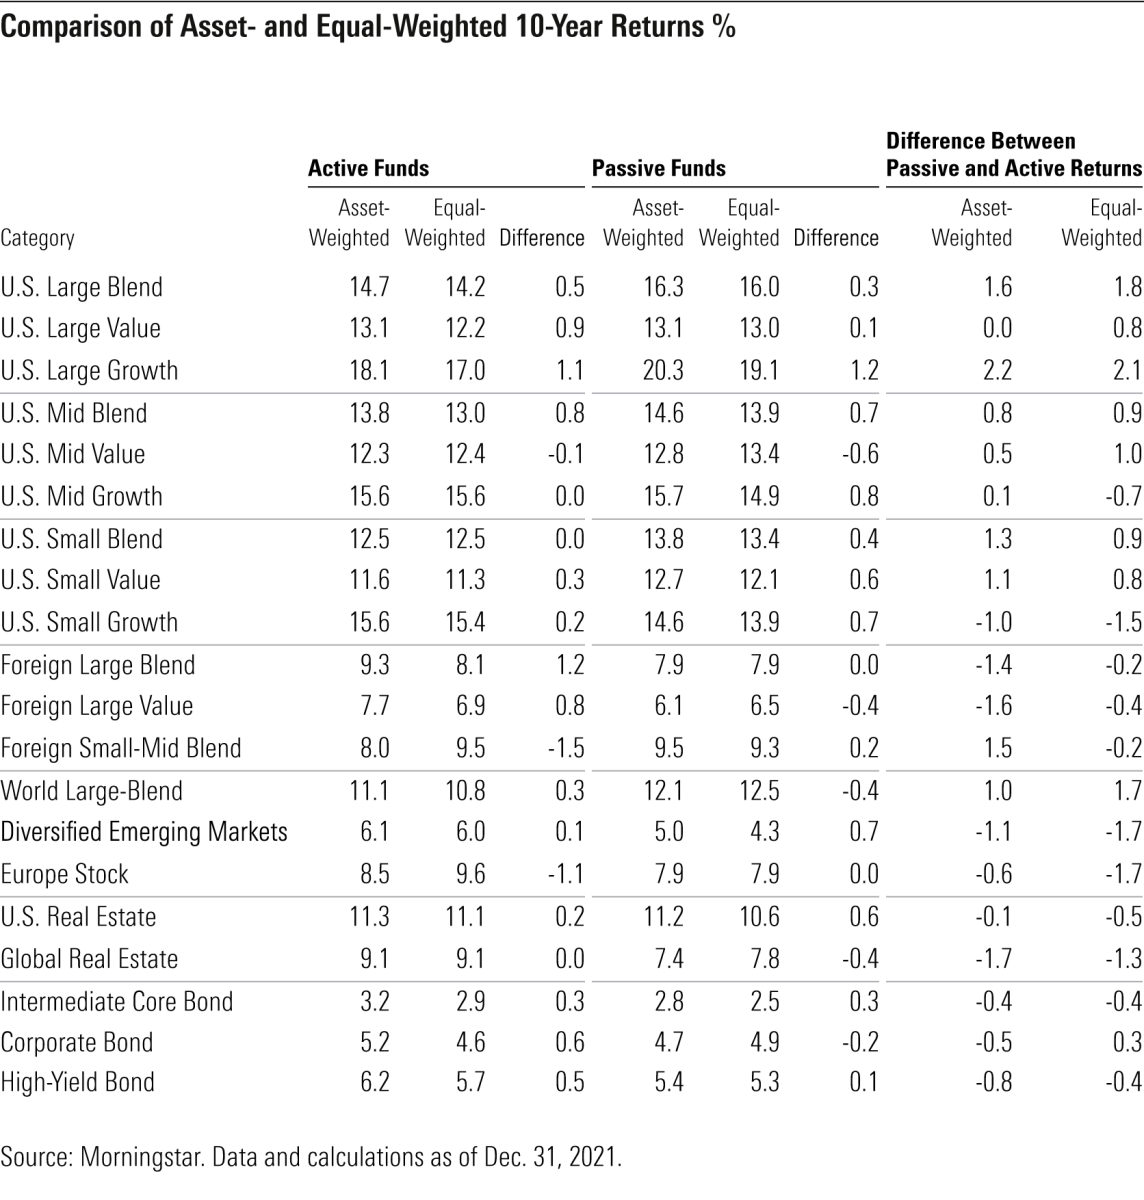
While a minority of actively managed funds have succeeded over the long term, investors have generally chosen above-average funds. Active funds’ asset-weighted average returns (which measure the performance of the average investor dollar) matched or exceeded equal-weighted returns (which measure the performance of the average fund) in 17 of the 20 categories we examined over the decade through the end of 2021, as shown in Exhibit 4. The difference between active and passive funds’ asset-weighted returns also contains useful information. In those cases where passive funds’ asset-weighted returns exceeded those of active funds, investors generally had more success with the former, and vice versa. So, over the past 10 years, investors generally fared much better with large-growth index funds than active ones. Conversely, they were better served by active managers in the emerging-markets categories than passive options.
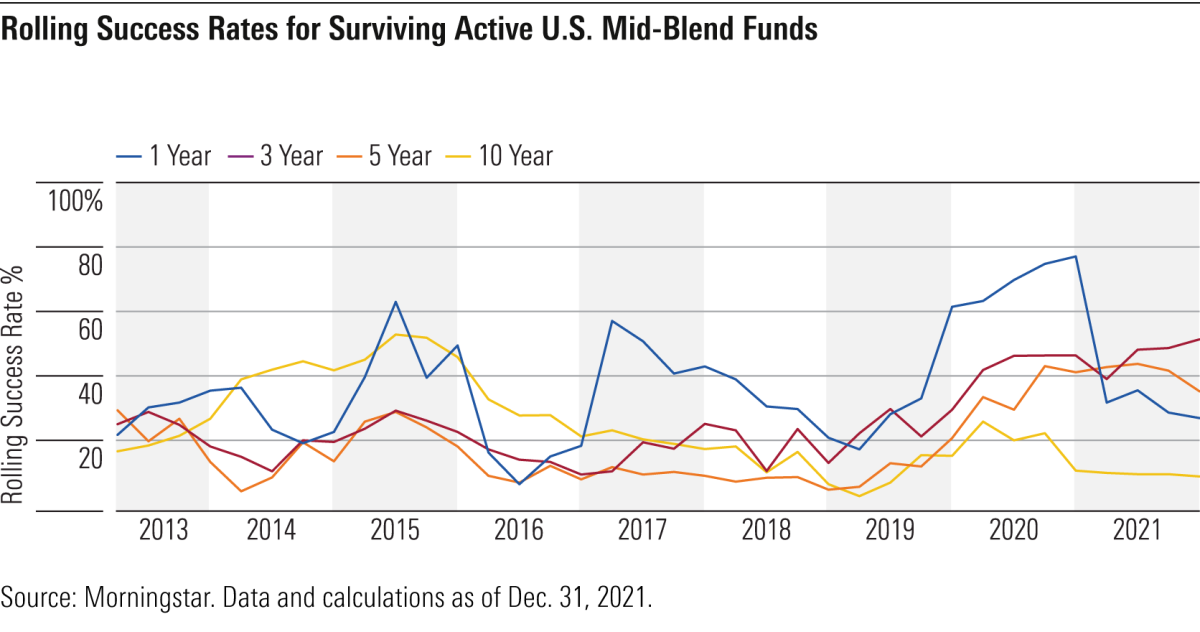
Actively managed funds’ short-term success rates are noisy. Their volatility can be influenced by countless factors. Over longer time horizons, there is less noise, and the signal regarding active funds’ odds of succeeding is clearer. In this instalment of our semiannual report, we have introduced charts that plot rolling success rates for active funds in each category, which better depict this phenomenon.
This is very apparent in the case of mid-blend funds. Exhibit 5 plots rolling success rates for actively managed funds in the category that represents a crossroads in the U.S. Morningstar Style Box. Short-term success rates can fluctuate dramatically in this space, as managers are buffeted by shifts in style leadership across the small-to-large and value-to-growth spectrums. But over a longer horizon the signal resonates with those that register across most other categories–long-term successes are rare.
Back to base rates
The Active/Passive Barometer is a useful starting point for investors looking to take the outside view when it comes to picking successful active managers. As for working from the outside in, it is little surprise that focusing on fees and picking your spots are some of the best ways to boost your base rate.
[1] Kahneman, D. 2011. Thinking, Fast and Slow. (New York: Farrar, Straus and Giroux).
Disclosure: Morningstar, Inc. licenses indexes to financial institutions as the tracking indexes for investable products, such as exchange-traded funds, sponsored by the financial institution. The license fee for such use is paid by the sponsoring financial institution based mainly on the total assets of the investable product. Please click here for a list of investable products that track or have tracked a Morningstar index. Morningstar, Inc. does not market, sell, or make any representations regarding the advisability of investing in any investable product that tracks a Morningstar index.
MORE FROM MORNINGSTAR
Active share has been a big disappointment
What should investors look for in an index?
Active managers failed their Covid test
Thematic funds: good stories, poor investments
OUR STRATEGIC PARTNERS
Content such as this would not be possible without the support of our strategic partners, to whom we are very grateful.
TEBI’s principal partners in the UK are S&P Dow Jones Indices and Sparrows Capital.We also have a strategic partner in Ireland — PFP Financial Services, a financial planning firm in Dublin.
We are currently seeking partnerships in North America and Australasia with firms that share our evidence-based and client-focused philosophy. If you’re interested in finding out more, do get in touch.
© The Evidence-Based Investor MMXXII