
By HAMISH PRESTON from S&P Dow Jones Indices
Many financial theories are based on the idea that riskier investments should offer higher returns. However, there is a bank of evidence – accumulated since the 1970s – showing that less volatile stocks posted higher risk-adjusted returns across a number of time horizons, regions, and market segments, historically.
S&P Dow Jones Indices produces a range of low volatility indices, which serve as benchmarks for investment strategies, globally. And as we have shown again and again, low volatility indices have offered upside participation and downside protection, historically. We recently extended the returns history for the S&P 500 Low Volatility Index back to February 1972, giving us nearly five decades of insight into the factor’s performance and characteristics. Here are a couple of takeaways from the newly available, back-tested history extension.
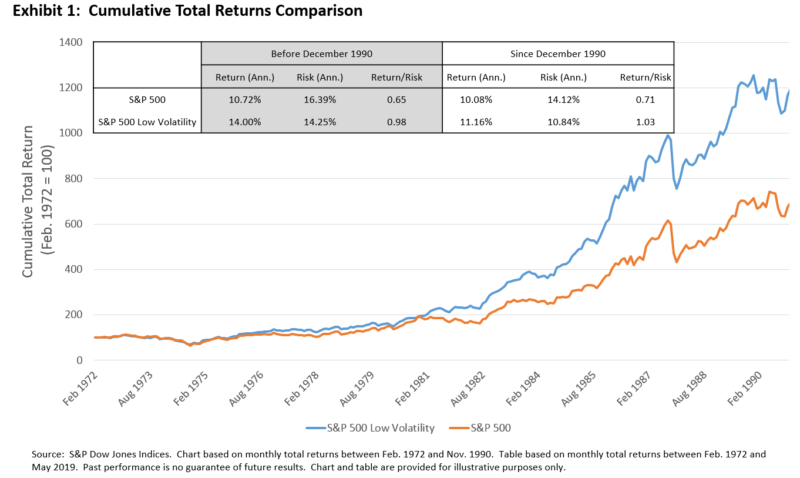
Low volatility outperformed in both absolute terms and on a risk-adjusted basis.
Exhibit 1 shows that S&P 500 Low Volatility Index outperformed the U.S. equity benchmark between February 1972 and November 1990, both in absolute terms and on a risk-adjusted basis. Its higher annualized returns and lower volatility than the S&P 500 resulted in a risk/reward ratio of 0.98, which was similar to the ratio observed during the latter period. Hence, the S&P 500 Low Volatility’s returns were similarly compensated for the risks being taken in the 1970s and 1980s compared to the period since December 1990.
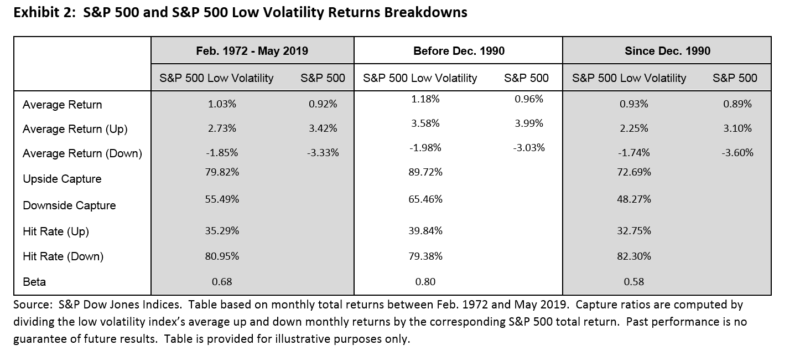
Upside participation and downside protection were preserved.
Exhibit 2 provides a breakdown of the S&P 500 and the S&P 500 Low Volatility indices’ returns over three horizons: from February 1972 to May 2019, between February 1972 and November 1990, and between December 1990 and May 2019. Up and down months are based on S&P 500’s monthly total returns.
While both indices posted similar average monthly total returns during the two distinct periods – before Dec. 1990 and since Dec. 1990 – the hit rates show that the low volatility index was slightly better (worse) at beating the S&P 500 during up (down) months before December 1990. Although this contributed to the low volatility index capturing a greater proportion of S&P 500 returns in the earlier period – it typically captured around 90% of the equity benchmark’s monthly gains and 65% of the S&P 500’s monthly declines – the S&P 500 Low Volatility index still offered upside participation and downside protection.
As a result, the key characteristics of low volatility indices remained intact over the four decades of (back-tested) index history: the S&P 500 Low Volatility Index displayed its usual asymmetric risk/return characteristics of upside participation and downside protection. Given these characteristics helped the low volatility index to outperform the broad-based market benchmark, the history extension provides further evidence of the potential advantage of focusing on the least volatile constituents in a given market.
HAMISH PRESTON is Associate Director of Global Research & Design at S&P Dow Jones Indices. You can read more of his articles here.
This article first appeared on the Indexology Blog and is republished here with permission.
Related posts:
Investors in boring, low-cost funds behave better
Does low volatility work across sectors and regions?
Don’t allow volatility to affect your focus