By LARRY SWEDROE
The main objective of the asset pricing literature is to determine which characteristics are most important for predicting returns. Another important goal is to build simplified models, using as few factors as possible while still providing a high level of explanatory power — to tame the so-called “zoo of factors”.
Niels Gormsen and Eben Lazarus contribute to the asset pricing literature with their April 2021 study, Duration-Driven Returns, the objective of which was to provide a simple framework for understanding the major equity risk factors in asset pricing. Their hypothesis was that the value, profitability, investment, low-risk and payout factors — factors that play a large role in asset pricing models — are driven by a premium on near-future (short-term) cash flows.
Gormsen and Lazarus tested this hypothesis using a new dataset of single stock dividend futures, which are claims on annual dividends for individual firms. They noted: “The main players in the dividend futures market are financial intermediaries and hedge funds, which are usually considered important for setting prices in the cross-section of stocks.”
Their data sample covered 66,228 stocks in 23 countries between August 1926 and December 2018. Data needed to construct investment, profit and payout characteristics was available from 1952. International equity data was available from 1990. Following is a summary of their findings:
- Firms with high expected long-term growth do have higher realised ex-post growth rates than firms with low long-term growth expectations.
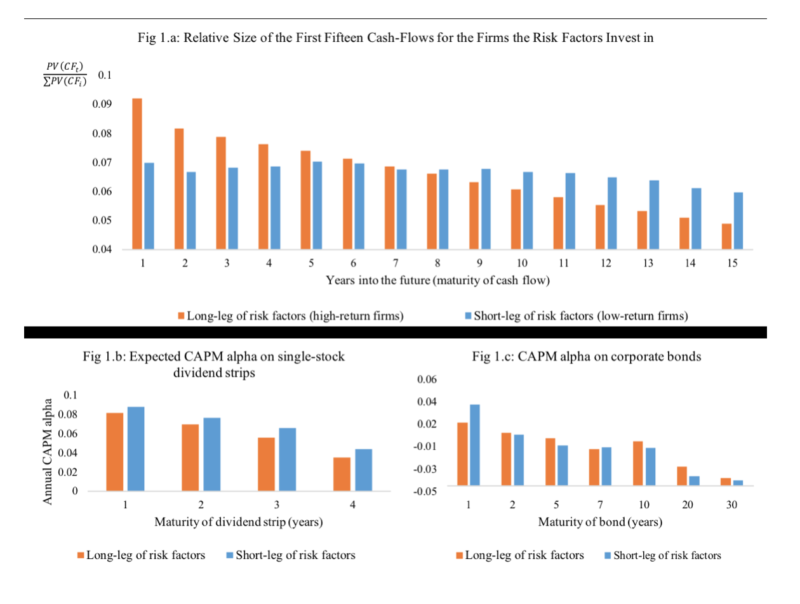
- Both in the U.S. and globally, each of the value, profitability, low-risk and payout factors invest in firms that earn most of their cash flows in the near future. Because these firms have low growth rates, their near-future cash flows are large relative to their distant-future cash flows, which is to say they have a short cash flow duration—the duration (the value-weighted time to maturity of a firm’s future cash flows) of their cash flows is lower (see figure 1.a).
- Risk-adjusted returns on individual cash flows decrease with the maturity of the cash flows, but they do not vary systematically across the underlying firms—the three-year claim on a high-investment firm has the same risk-adjusted return as the three-year claim on a low-investment firm. The implication is that it is the duration of cash flows, not other firm-level characteristics, that drives the return premium on short-duration firms.
- While longer-duration portfolios have higher market betas, their average returns are nearly identical to the average returns on short-duration portfolios, leading to significant alphas on those short-duration portfolios.
- Consistent with their hypothesis, the expected CAPM alphas on individual cash flows decrease in maturity within a firm but do not vary across firms for a given maturity. For example, the alphas start at around 8 percent per year for the one-year claim and decrease to around 4 percent for the four-year claim (see figure 1.b).
- The large alpha was driven neither by the small-cap firms nor by the short leg of the portfolio alone, and the results were robust across sub-periods.
- Controlling for the duration factor substantially increased the r-squared, and it explained most of the CAPM alpha to these factors, although the profit factor remained statistically significant.
- In a test of robustness, similar findings were found for corporate bonds (see figure 1.c).
Gormsen and Lazarus also found that the slope of the equity yield curve is generally highly correlated with the slope of the bond yield curve with the exception of a high inflation period beginning in the late 1970s. They calculated the level of the equity yield curve as the average log book-to-market ratio of the four portfolios that constituted the duration factor. Similarly, they calculated the slope of the equity yield curve as the average log book-to-market ratio of the two long-duration portfolios in the duration factor minus the average log book-to-market ratio of the two short-duration portfolios in the duration factor.
From 1929 to 1974, the correlation between the slopes of the equity and bond yield curves was 0.72, and from 1995 to 2018, the correlation was 0.62. During the high inflation period from 1974 to 1995, the two curves were only weakly correlated (r-squared 0.08). This should be expected, as the bond yield curve to a large extent reflects inflation expectations that are less relevant for assets with significant real risk, like equities. The authors found that the slope of the equity yield curve also predicts the returns to the major equity risk factors, and it predicts the timing of the return on the market portfolio.
They also found that a higher equity yield curve predicts higher returns, and a more upward sloping equity yield curve predicts lower returns. The effect was strongest, and statistically significant, for the four- and five-year horizons. The r-squared was as high as 41 percent for the five-year return. The slope of the bond yield curve also predicts returns, but it does so with the opposite sign—the slope of the bond yield curve predicts the bond term premium. They added: “Since the market is a long-duration claim, the bond term premium should carry over to the equity risk premium, which means the slope of the bond term structure should predict the equity risk premium positively.”
Their findings led Gormsen and Lazarus to conclude: “The major risk factors share a common feature, namely that their long legs all invest in firms with low growth rates relative to their short legs. This result holds when looking at realized growth rates in both dividends and earnings. It also holds when looking at expected growth rates from analyst forecasts, both in the US and internationally.” They called the common trait a duration risk factor.
The authors added: “Firms with short cash-flow duration are less exposed to the discount-rate shocks that account for much of the variation in aggregate prices, causing them to co-move less with the market and thus have low betas. … The firms in the long legs of the risk factors have both low growth rates and high expected returns, leading together to these firms having short cash-flow duration. The stylised fact that the major risk factors buy firms with low growth rates can therefore be restated as the finding that the major risk factors buy firms with short cash-flow duration.”
Gormsen and Lazarus also noted that their findings were consistent with prior research, including the 2016 study The Term Structure of Returns: Facts and Theory. The authors, Jules van Binsbergen and Ralph Koijen found that:
- Both risk premia and Sharpe ratios are higher for short-maturity claims than for the aggregate stock market. This is also true for corporate bonds.
- The returns on short-term dividend claims are risky as measured by volatility, but safe as measured by market betas.
- The volatility of equity yields is downward sloping with maturity.
The risk-based explanation for the premium return on short-duration equities is that the return on short-term dividend claims is risky, being highly exposed to the “worst states of the world”. For example, the value of near-future dividends dropped by as much as 40 percent during February and March 2020 as the coronavirus crisis unfolded. Gormsen and Lazarus explained: “If near-future dividends are highly exposed to such bad economic shocks, it may help explain why their returns are high relative to more-conventional measures of risk.”
They also noted that there are behavioural-based explanations proposed for the higher returns to short-duration assets. For example, investors tend to overestimate the growth rates of high-growth firms and underestimate the growth rates of low-growth firms. However, this theory cannot explain why the long-maturity claims have lower expected risk-adjusted returns than the short-maturity claims for the dividend futures. Another behavioural explanation is that there are investors with a preference for lottery-like stocks (which tend to be long-duration stocks), leading to their overvaluation.
Investor takeaways
Gormsen and Lazarus provide us with some new and important insights into the cross-section of expected returns. Their insights also provide support for value investors, as the bond yield curve has steepened significantly (at the beginning of March 2020, the spread between the one-month Treasury bill and the 10-year note was about -0.3 percent versus about 1.6 percent at the start of June 2021), and the equity yield curve remains steep, as the spread in valuations between growth and value stocks remains near historic highs despite the strong recovery in value since September 2020.
The information presented herein is for educational purposes only and should not be construed as specific investment, accounting, legal or tax advice. Certain information may be based on third party data which may become outdated or otherwise superseded without notice. Third party information is deemed to be reliable, but its accuracy and completeness cannot be guaranteed. By clicking on any of the links above, you acknowledge that they are solely for your convenience, and do not necessarily imply any affiliations, sponsorships, endorsements or representations whatsoever by us regarding third-party Web sites. We are not responsible for the content, availability or privacy policies of these sites, and shall not be responsible or liable for any information, opinions, advice, products or services available on or through them. The opinions expressed by featured authors are their own and may not accurately reflect those of the Buckingham Strategic Wealth® or Buckingham Strategic Partners® (collectively Buckingham Wealth Partners). LSR-21-133
LARRY SWEDROE is Chief Research Officer at Buckingham Strategic Wealth and the author of numerous books on investing.
ALSO BY LARRY SWEDROE
Factor drift: what it is and how to tackle it
Don’t be fooled by private equity returns
Institutional investors vs individuals: Who wins?
© The Evidence-Based Investor MMXXI
Robin is a journalist and campaigner for positive change in global investing. He runs Regis Media, a niche provider of content marketing for financial advice firms with an evidence-based investment philosophy. He also works as a consultant to other disruptive firms in the investing sector.