
The late City businessman and politician Lord Myners used to swear by what he called the Inertia Test. The more fund managers traded, he argued, the worse they performed. “The simplest way to see this effect,” he wrote in a letter to the FT in April 2018, “is to ask your fund manager ‘how would the investment portfolio you manage for me have performed if you had done nothing during the measuring period, just sitting on the original portfolio?’ In my experience this analysis shows that well over 50 per cent of fund managers of diversified equity funds produce lower returns than would have been achieved if they had gone on holiday for the full period.”
It sounds like a joke, but it isn’t. New analysis by researchers at Morningstar shows that, for the ten-year period to the end of March this year, managers of active U.S. large-cap funds really would have delivered higher returns if had they taken a ten-year holiday and not placed a single trade.
True, this is just one class of funds, and one ten-year period. And, as Morningstar’s chief ratings officer JEFFREY PTAK says, more research is needed. But these latest findings confirm that Lord Myners genuinely had a point: doing nothing really does pay off.
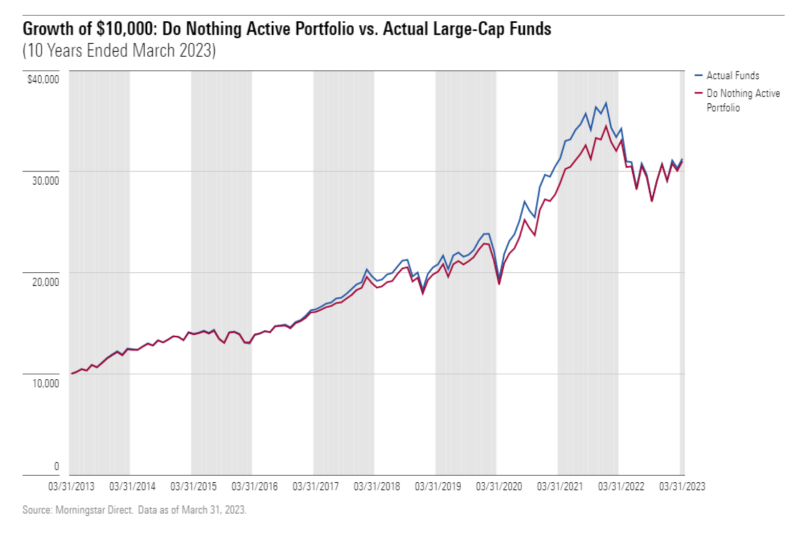
A few weeks ago I wrote about the improbable success of the “Do Nothing Portfolio”. To review, the Do Nothing Portfolio is a hypothetical portfolio whose strategy couldn’t have been simpler: It bought all 500 of the S&P 500′s holdings as of March 31, 2013, mirrored their weights, and then did nothing thereafter. It just held them. We found the Do Nothing Portfolio would have gained about as much as the actual S&P 500 did over the decade ended March 31, 2023, but it was less volatile.
These “do nothing” hypothetical tests need not be limited to indexes. We can also conduct them on other universes to see whether investors would have been better off had the holdings been left well enough alone. So that’s what we did.
Putting active funds to the “Do nothing” test
With the help of my colleague Madison Sargis, we compiled a list of all stocks held by actively managed U.S. large-cap funds as of March 31, 2013. The study spanned more than 400 distinct funds that held nearly $2 trillion in assets as of that date. Those assets were spread across thousands of stocks, whose actual holding values we recorded. We’ll refer to this as the “Do Nothing Active Portfolio.”
We took the same approach to this test as we did the prior “do nothing” test we performed on the S&P 500. Namely, we used each stock’s monthly total return to adjust its value, repeating for all 120 months. If a stock was delisted, for instance, because it was acquired, we assumed the proceeds of the sale sat in cash from the time of the delisting to the end of the ten-year period. To arrive at the Do Nothing Active Portfolio’s value at the end of a month, we summed the value of the individual holdings. And then we derived monthly returns by comparing one month’s ending value to that of the prior month.
Once we had calculated the Do Nothing Active Portfolio’s monthly returns, we compared them with the actual before-fee returns of the funds, which we assumed were bought in proportion to their size (that is, net assets) as of March 31, 2013, and held to the end of the ten-year period.¹
The difference between the static portfolio’s hypothetical returns and the funds’ actual returns would approximate the value the funds’ active managers added to, or subtracted from, performance by trading stocks along the way. Considering that active managers buy and sell trillions of dollars worth of stocks each year, the benefits that these trades confer to investors isn’t a trivial matter, explaining our interest.
Findings
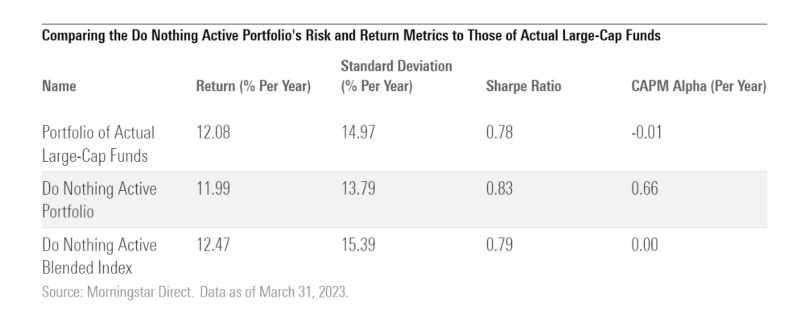
We found the Do Nothing Active Portfolio would have earned nearly the same return as the actual active large-cap funds did in aggregate. The Do Nothing Active Portfolio gained 12.0% per year over the 10 years ended March 31, 2023, while the actual funds notched a 12.1% annual gross return. By this measure, the active fund managers’ trading decisions added little value before fees.
Moreover, because the Do Nothing Active Portfolio would have been less volatile than the actual funds, it would have earned a higher Sharpe ratio² than the actual funds did and generated a positive capital asset pricing model alpha (versus a custom blended benchmark).³ By contrast, the actual active funds weren’t able to eke out a positive alpha. By these measures, the actual funds’ trading activity subtracted value, and that’s before expenses come into play.
How the ten biggest funds did
Time didn’t allow us to compare every single one of the active funds in our dataset to its “do nothing” comparable. But we were able to run the numbers for the 10 funds that were largest by net assets as of March 31, 2013.
For each fund, we froze its portfolio as of March 31, 2013, and estimated the frozen portfolio’s subsequent ten-year return using the method described above. Then we compared that estimated “do nothing” return to the fund’s actual ten-year before-fee return.
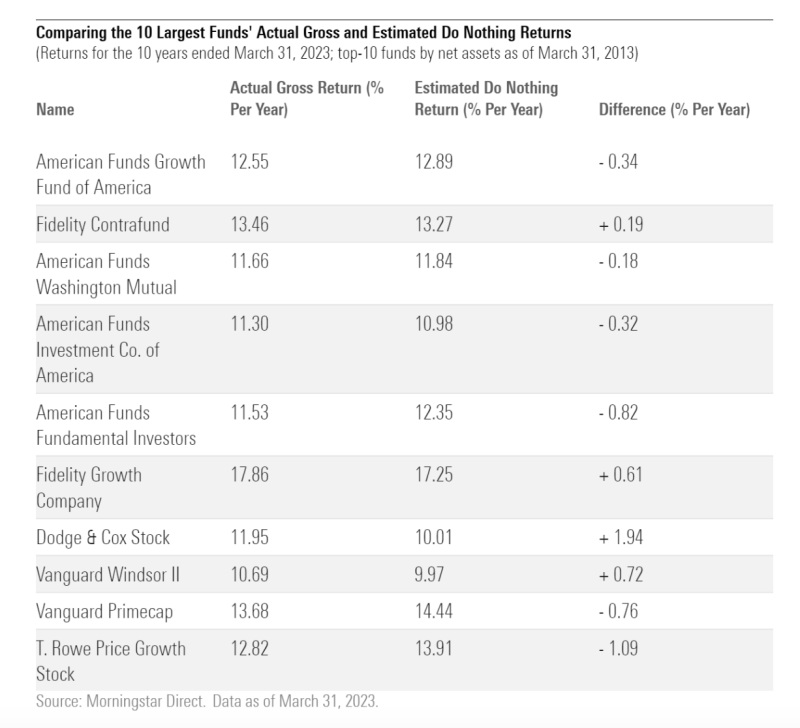
To choose one example, American Funds Fundamental Investors began the ten-year period with Home Depot and Amazon.com as its two largest positions, with those names soaking up around 3% of assets apiece. Home Depot proceeded to gain fivefold over the subsequent 10 years ended March 31, 2023, while Amazon gained a cumulative 675% over that span. Had those positions been left untouched, each would have swelled to about 6% of assets. But by March 31, 2023, Home Depot was gone and Amazon accounted for just 0.9% of assets, the result of trimming. This partly explains why the actual fund lagged its “frozen” version.
The opposite held for Fidelity Growth Company, which began and ended the ten-year period with Apple as its top holding. On March 31, 2013, that position accounted for about 4.6% of assets, and by the finish (or more precisely Feb. 28, 2023, which is most recent portfolio available to us) it had grown to a nearly 12% weight. That’s a bigger weighting than Apple would have achieved had it had been left untouched, as its final weighing in the “do nothing” version of Fidelity Growth Company was 11% of assets. The manager’s flexibility to hang on, even after the stock’s torrid gains, paid off.
When doing nothing worked
Why did the Do Nothing Active Portfolio fare as well as it did? It appears to boil down largely to two factors: 1) The Do Nothing Active Portfolio gave its winners room to run, and run they did; and 2) the Do Nothing Active Portfolio held extra cash, which acted as a shock absorber, smoothing the ride.
Here is a time lapse of the Do Nothing Active Portfolio’s weighting in what ended up being its largest holdings as of March 31, 2023: Apple, Microsoft, Alphabet, Amazon, and Home Depot. On average, those names soaked up around 13% of the hypothetical portfolio’s weight over the ten-year period, rising to more than 18% by the end. Their aggregate weight roughly tripled from start to finish, all of that owing to market appreciation.
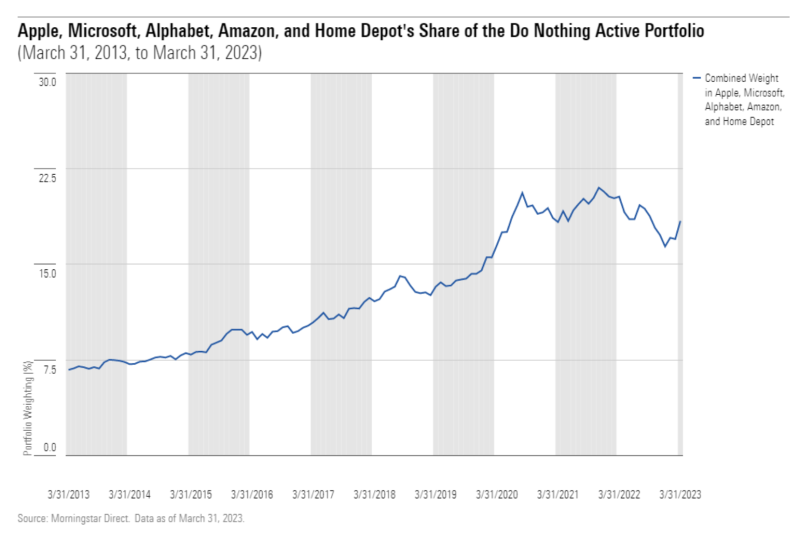
While active large-cap funds might have eventually come to own a similar weighting in these names by the end of the ten-year period, they didn’t capture as much of the stocks’ upside as the Do Nothing Active Portfolio did. That’s because many raised their stakes after the stocks had run up, missing out on gains the Do Nothing Active Portfolio fully partook in.
The second variable is the Do Nothing Active Portfolio’s cash stake. While it would have been identical to active large-cap funds’ actual aggregate cash weighting at the start of the ten-year period, it grew over time, reflecting the delisting of names that were acquired, with the cash proceeds adding to the cash pile. (Dividends don’t explain it, as each stock’s monthly return is derived assuming reinvestment of any dividends.) On average, the Do Nothing Active Portfolio held about 8.5% of assets in cash over the ten-year period, more than double the large-cap funds’ average stake over that span.
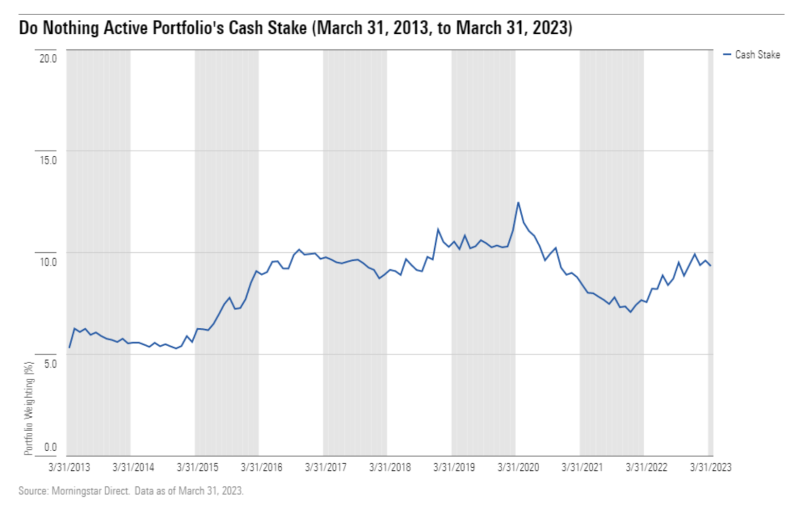
While this unquestionably dragged on the Do Nothing Active Portfolio’s returns in the good times (as we assumed cash and any bond holdings earned nothing), it provided needed ballast in bad times like early 2020 and last year.
Conclusion
While active large-cap managers made thousands of trades worth trillions of dollars over the ten-year period ended March 31, 2023, it doesn’t appear those transactions conferred significant benefits to investors. The funds’ actual returns were almost identical to what they’d have been had those managers made no trades at all and were worse after adjusting for risk. And that was before fees were deducted.
These findings aren’t conclusive, as the Do Nothing Active Portfolio is hypothetical in nature and the study covered just a single ten-year period. Further research is needed. But based on these preliminary findings, it can be useful to compare managers’ actual performance to what they would have achieved by doing nothing, with more systematic techniques than the ones we employed likely to yield deeper insights into the relationship between managers’ investment decisions and the value they add to, or subtract from, returns.
END NOTES
¹ If a fund merged into another before the ten-year period ended, we assumed that the acquired fund’s assets earned the acquiring fund’s monthly returns in the period subsequent to the merger.
² Of the 2,178 active large-cap funds that existed on March 31, 2013, only 354 survived to the end of the ensuing ten-year period and notched a higher before-fee Sharpe ratio than the Do Nothing Active Portfolio did. That figure fell to 92 funds after deducting fees.
³ The custom blended index was split between the Russell 1000 Value, Russell 1000, and Russell 1000 Growth indexes, which are the benchmarks assigned to the large-value, large-blend, and large-growth Morningstar Categories, respectively. We assigned a 31% starting weight to the Russell 1000 Value, a 25% starting weight to the Russell 1000, and a 44% starting weight to the Russell 1000 Growth, with those weightings mirroring the asset-weighted category breakdown of the active large-cap funds included in the test as of March 31, 2013. The index was not reconstituted.
JEFFREY PTAK is chief ratings officer for Morningstar Research Services. This article was first published on the Morningstar blog.
MORE FROM MORNINGSTAR
The Big Shortcoming: a dismal decade for active large-growth
European active managers blew another big chance in 2022
Striving for investing perfection usually leads to disappointment
LISTEN TO ROBIN POWELL SPEAK IN LONDON
TEBI founder Robin Powell and his co-author Jonathan Hollow will be speaking about the murky world of investment fees and charges in London at 5.30pm on Wednesday 17th May 2023.
They’ll be explaining you may be paying for a nice retirement for people you don’t even know, and what you can do start funding YOUR dream life instead.
The event is free, but places are limited, so book early to avoid disappointment:


