By LARRY SWEDROE
The holy grail for investors is the ability to identify which of the few active mutual funds will outperform in the future. Despite an overwhelming body of academic research having demonstrated that past performance doesn’t guarantee future performance and (as the annual SPIVA Persistence Scorecards regularly report) there is less persistence of outperformance than randomly expected, believers in active management were offered hope with the study by Martijn Cremers and Antti Petajisto, How Active Is Your Fund Manager: A New Measure That Predicts Performance, published in the September 2009 issue of The Review of Financial Studies. The authors concluded: “Active Share predicts fund performance: funds with the highest Active Share significantly outperform their benchmarks, both before and after expenses, and they exhibit strong performance persistence.”
Active Share is a measure of how much a fund’s holdings deviate from its benchmark index, and funds with the highest active share tend to have the best performance. Thus, while there’s no doubt that, in aggregate, active management underperforms and the majority of active funds underperform every year (and the percentage that underperform increases with the time horizon studied), if an investor were able to identify the few future winners by using Active Share as a measure, active management could be the winning strategy.
Unfortunately, subsequent research has found problems with the conclusions drawn by Cremers and Petajisto. For example, criticisms of the study included that their findings were due to the choice of benchmark, and their results were skewed by the returns of a few very small funds. In May 2012, Vanguard’s research team looked at the issue of active share as a predictor. Their study covered the 1,461 funds available at the beginning of 2001. Their final fund sample comprised 903 funds. Because the study only covered surviving funds, there’s survivorship bias in the data. Refuting the findings of Cremers and Petajisto, they found that even with survivorship bias, with proper benchmarks, higher levels of active share didn’t predict outperformance.
Using the same database employed in the Cremers and Petajisto study, Andrea Frazzini, Jacques Friedman and Lukasz Pomorski of AQR Capital Management examined the evidence and the theoretical arguments for active share as a predictor of performance and presented their findings and conclusions in the March 2015 paper Deactivating Active Share, published in the March/April 2016 issue of the Financial Analysts Journal. The authors concluded that, controlling for benchmarks, active share has no predictive power for fund returns.
The October 2016 paper by Ananth Madhavan, Aleksander Sobczyk and Andrew Ang of BlackRock, Estimating Time-Varying Factor Exposures, provided an out-of-sample test (post-2009) of Cremers’ and Petajisto’s findings. They found that the measure of active share proposed by Cremers and Petajisto actually was negatively correlated (-0.75) to fund returns after controlling for factor loadings and other fund characteristics. Thus, they concluded that “It is not the case that high conviction managers outperform.”
In another out-of-sample test that used data from 2001 through 2015 on Canadian funds, Morningstar found that after adjusting for the market, size, value and momentum factors, there was no predictive value for active share. The only thing that Active Share predicted, which should be expected, was a wider dispersion of performance outcomes—investors were taking greater risk without compensation.
Another out-of-sample test of active share was provided in the December 2017 study Defining Activeness: Active Share, Risk Share & Factor Share. In their study of South African funds over the period June 2003 through March 2017, authors Emlyn James Flint, Anthony Seymour and Florence Chikurunhe found that once the results were adjusted for exposures to risk, “there is no discernible relationship between current active share and future active return.”
Another paper we need to review is Cremers’ own October 2016 study, Active Share and the Three Pillars of Active Management: Skill, Conviction and Opportunity. This updated study covered the period 1990 through 2015 and is free of survivorship bias. To determine alpha, Cremers used a seven-factor model. In addition to market beta and momentum, he used two size factors and three value factors because size and book-to-market have different relationships with stock performance depending on whether one considers all stocks, only large cap, only mid-cap or only small-cap stocks.
While he did find that the highest active share had an abnormal (unexplained) return of 0.71 percent per year, it was not statistically significant (t-stat was just 1.37). He did note that the evidence that high-active-share funds outperformed low-active-share funds was stronger for funds with low expense ratios and low turnover. Given that his data indicated the outperformance had occurred prior to 2002, I contacted Professor Cremers and asked him if he had performance data for the period 2002 through 2015. He provided me with the table below, which shows the results over that timeframe for the active share quintile portfolios (the first quintile is the lowest active share).

The most recent contribution to the literature on active share is Vanguard’s July 2019 paper, The Urban Legends of Active Share. Their database covered actively managed U.S. open-end equity mutual funds over the 15-year period 2004-2018, including liquidated and merged funds. The following is a summary of their findings:While active share may have worked prior to 2002, these results show that even the highest quintile of active share funds produced negative alphas in the post-2002 period. In other words, as markets have become more efficient over time, the alpha was “gone with the wind.”
— On average, low-cost, low-active-share funds — part of the category of “closet index funds” — outperform high active-share funds.
— There is a significant positive relationship between Active Share and expense ratios. Funds with higher Active Share tend to charge more. It is this relationship that leads to a negative relationship between Active Share and net excess return. Thus, what you pay per unit of Active Share is important.
— Active Share is not a compensated risk premium — it leads to a wider dispersion of outcomes without a corresponding increase in average returns.
Vanguard went on to note: “High active-share funds can make it more difficult to stay the course with active strategies — they add another layer of uncertainty to active equity investing that investors should be aware of.” They added: “This larger dispersion of outcomes can be an indication of more extreme performance-chasing.” Performance chasing leads investors (both individual and institutional) to underperform the very funds in which they invest.
Summary of the evidence
The bottom line is that in the face of all the evidence, it is difficult to make the case that active share has any predictive value in terms of future risk-adjusted outperformance. Despite this, active share seems to be becoming an increasingly popular metric both in terms of reporting and evaluation. Given the evidence, there doesn’t seem to be a logical explanation for the phenomenon other than a high active share is a necessary ingredient for outperformance. Unfortunately, it’s not a sufficient one.
There’s one more important point we need to cover.
But remember… It’s not all about alpha
Investors may want to own a fund that provides exposure to factors they care about, such as market beta, size, value and momentum. They should then be happy to have minimal alpha as long as they get the beta (loading on a factor) they are seeking, which leads to higher returns. In other words, such investors should rather own a low-cost, passively managed small value fund that provides high loadings on those factors and minimises or even eliminates negative exposure to momentum (typical of value funds) and has no alpha than an active fund with less exposure to those factors even if it generates positive alpha. Its positive alpha would have to be great enough to overcome the loss of returns due to the lower loading on the factors. To illustrate this point, consider the following example.
We’ll compare the returns, loadings on factors, and alphas for two funds from the same asset class (US large value): the actively managed Vanguard Equity Income Fund (VEIPX) and the passively managed (rules based and systematically implemented) DFA US Large Cap Value III Portfolio (DFUVX). (Full disclosure: My firm, Buckingham Strategic Wealth, recommends Dimensional funds in constructing client portfolios.)
The data is for the longest period we have available, March 1995 through June 2019. The factor loadings and returns come from Portfolio Visualizer and use the Fama-French benchmark factors and the three-factor model while the factor premiums are from Ken French’s data library.
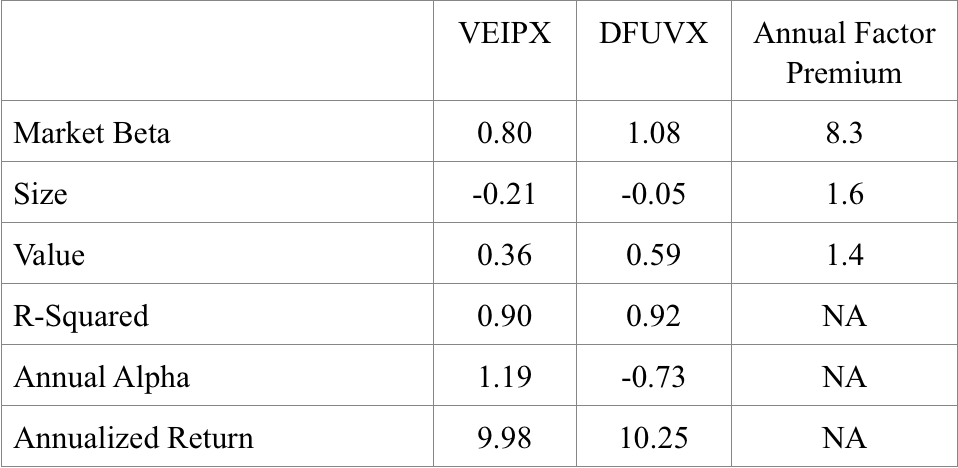
First, observe that the r-squared figures are high, indicating that the model is doing a good job of explaining returns. Second, as you can see, while VEIPX produced a positive annual alpha of 1.19 percent and DFUVX produced a negative alpha of -0.73 percent (a difference of 1.92 percentage points), DFUVX provided a 0.27 percentage point higher return.
The reason for the outperformance is clear. DFUVX had much higher loadings on factors that delivered premiums. This allowed DFUVX to overcome the 1.92 percentage point difference in alpha.
While alpha is nice, you only get to spend returns. Thus, it’s important to consider all of these issues, including turnover, expense ratios and loading on factors.
LARRY SWEDROE is Chief Research Officer at Buckingham Strategic Wealth and the author of 17 books on investing, including Think, Act, and Invest Like Warren Buffett.
Larry is a regular contributor to TEBI. Here are some of his other recent articles:
How interest rates affect risk taking
Do yield curve inversions tell us anything useful?
Talk of a passive bubble is just hot air
Are IPO stocks worth the risk?
Persistent outperformance remains very elusive