
By LARRY SWEDROE
Value stocks have dramatically underperformed since 2017. So it’s not a surprise that as the chief research officer for Buckingham Strategic Wealth, I’ve been getting lots of questions from investors and advisors alike concerned about the “death of value”. Before you become convinced of its death, let’s take a ride with Mr Peabody’s WABAC machine to see what lessons history can provide.
Travelling back to the end of the last millennium, we can see that the death of value had been declared before. Over just the two years 1998-99, in terms of total returns the Russell 3000 Growth Index outperformed the Russell 3000 Value Index by 59.6 percentage points (80.7 percent vs. 21.1 percent). Value was declared dead, as this was a new era. It seems likely that those making that declaration never bothered to check Ken French’s data library.
Using that data, we can proxy the U.S. market value series for the Russell 3000 Value Index and the U.S. market growth series for the Russell 3000 Growth Index. If they had done so, perhaps they would have noticed that over this same period the ratio of the price-to-earnings (P/E) of those two indexes had widened by 63 percent. It started the period at 3.2 (10.1 for value vs 32.3 for growth) and finished at 5.1 (7.8 for value vs. 40.0 for growth). In other words, more than 100 percent of the outperformance of growth was due to the “speculative return” (valuations) instead of the “fundamental return” (earnings).
Today we know that over the next 17 years (2000-16), the Russell 3000 Value Index outperformed the Russell 3000 Index by 147.2 percentage points in terms of total return (207.5 percent vs 60.3 percent).
I’ve often written about how markets teach us lessons if we pay attention. And many times it teaches remedial courses, lessons it taught in prior years but have been forgotten.
Déjà vu all over again
From 2017 through March 2020, in terms of total returns the Russell 3000 Growth Index outperformed the Russell 3000 Value Index by 51.7 percentage points (46.7 percent vs. -5.0 percent). Checking the spread in P/E ratios, we find that its widening explained almost all of the underperformance of value stocks. The P/E ratio of the Russell 3000 Growth Index increased slightly from 23.0 to 23.4 while the P/E ratio of the Russell 3000 Value Index fell from 18.5 to 13.0. This resulted in a widening of the spread between them of about 45 percent (from about 1.2 to about 1.8).
In other words, if the valuation ratio between them had remained unchanged, value would have underperformed by a total of about 7 percentage points over the period and we would not be discussing the death of value.
The period from 1992 through 2016
Let’s now go back to the end of 2016 and ask if the value premium was dead based on the out-of-sample test. The original paper on the value premium by Eugene Fama and Kenneth French, The Cross-Section of Expected Stock Returns, covered the period 1927 through June 1991. We can thus examine the 25-year period 1992 through 2016.
During this period, the Russell 1000 Growth Index returned 8.2 percent per annum, underperforming the Russell 1000 Value Index return of 10.1 percent by 1.9 percentage points per year. The Russell 2000 Growth Index returned 7.4 percent per year, underperforming the Russell 2000 Value Index, which returned 11.5 percent per year, by 4.1 percentage points per year.
The annual average value premium was 4.5 percent, not much different than the 5.1 percent premium for the period 1927 through 1991. I don’t think anyone would have declared the value premium dead based on those figures. Yet, just three years later, we heard a clarion cry that publication of the research and cash flows had killed the value premium.
Does anyone seriously believe that 25 years was not enough time for publication to kill the premium, but three more years did the trick? If cash flows had killed the premium, 25 years of them should have been long enough to accomplish the task. And if cash flows had killed the premium, how did valuation spreads widen dramatically over the last three years? Cash flows into value should have narrowed the premium!
It’s history lessons like these that explain why one of my favorite expressions is that what you don’t know about investing is often the investment history you don’t know.
Valuation spreads are the best predictors of future returns
Another lesson history provides is that valuation spreads — while they are not perfect predictors of the future and cannot be used to time factors or asset classes — are the best predictors of future returns.
For those interested in observing what history tells us about the returns to value stocks when the valuation spread is historically wide (as it is today), I recommend Cheap vs. Expensive Factors: Does Valuation Matter for Future Returns?
We have one more history lesson, demonstrating how quickly reversion to the mean of returns can occur.
History provides lessons, assuming you know your history
To demonstrate how just a few years’ performance can impact investor perceptions, we can look back to the similar period 1998-99 over which the value premium was a cumulative -32 percent. That dramatic underperformance also led many to conclude that value was dead.
In fact, just as we see today, the poor performance of value stocks over that short period caused value stocks to underperform growth stocks over periods as long as 15 years. (Fama-French data is from Ken French’s website.)
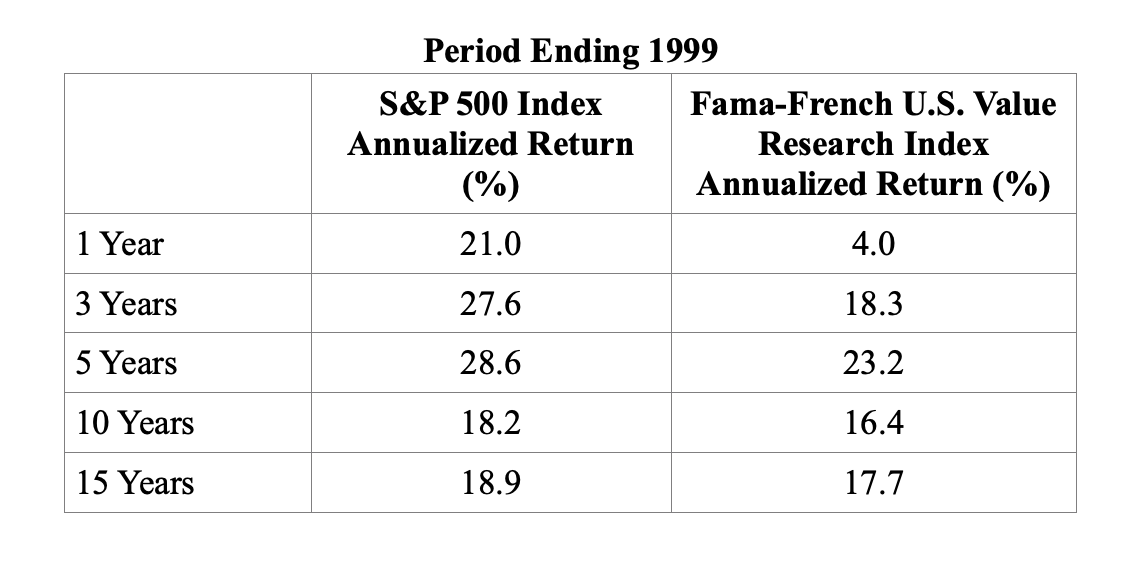
Now let’s jump forward just one year, to the end of 2000, and see how the world looked.
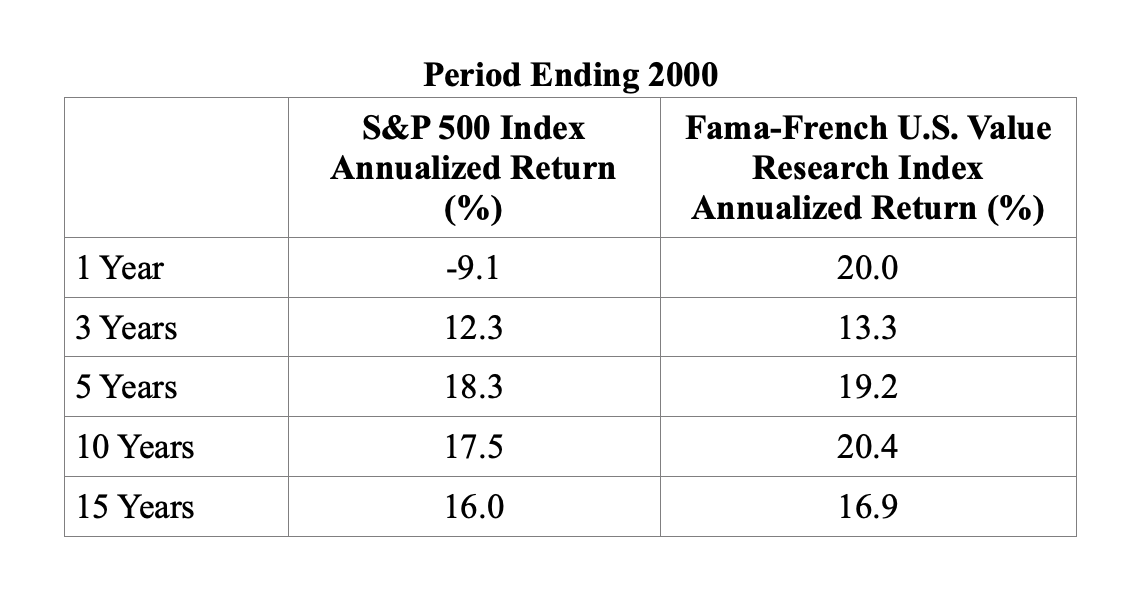
Moving forward just one single year, we find that value stocks had outperformed over each of the periods. The lessons are that there is a lot of volatility in factor performance and that even long periods of underperformance can be reversed over very short time frames.
The bottom line is that the declaration of the death of the value premium seems premature.
Important disclosure: Indices are not available for direct investment. Their performance does not reflect the expenses associated with the management of actual portfolios nor do indices represent results of actual trading. Information from sources deemed reliable, but its accuracy cannot be guaranteed. Performance is historical and does not guarantee future results. Total return includes reinvestment of dividends and capital gains.
When constructing client portfolios my firm recommends Dimensional Fund Advisors funds to clients.
LARRY SWEDROE is Chief Research Officer at Buckingham Strategic Wealth and the author of numerous books on investing.
Want to read more of his work? Here are his most recent articles published on TEBI:
Can you trust bond fund classification?
Is the rise of indexing bad for corporate governance?
Is it really stocks for the long run?
The Illusion of alpha in active bond management
Four investment lessons from the COVID crisis
A ten-year record is random noise
© The Evidence-Based Investor MMXX


