
We’ve been hearing a great deal lately about inverted yield curves. In simple terms, an inverted yield curve marks a point on a chart where short-term investments in government bonds pay more than long-term ones. We’ve now reached that point with US Treasuries, UK gilts and other popular government bonds around the world.
Yield curve inversions are generally viewed as a bad sign for the economy. We haven’t seen them since 2008, and we all know what happened then.
But how worried should we be? As Larry Swedroe mentioned in a recent TEBI article, the academic evidence shows that yield curve inversions don’t provide investors with useful information.
For example, a study earlier this year by Kenneth French and Eugene Fama found “no evidence that yield curve inversions can help investors avoid poor stock returns.” French and Fama added that this “implies that investors who try to increase their expected return by shifting from stock to bills after inversions just sacrifice the reliably positive unconditional expected equity premium.”
New research from Belgium has produced very similar conclusions. GERTJAN VERDICKT, Research Fellow in Financial History at the University of Antwerp, has studied all the yield curve inversions that have incurred in Belgium since 1840. Here he explains what he discovered, and the key takeaways for investors.
Over the last few months, much of the financial press expressed concerns about the impact of inverted yield curves on financial markets, in particular, the stock returns. Some previous academic literature has shown that there exists a link between yield curves and economic growth (see references below). However, the question remains whether yield curve inversions can be used as a predictive indicator of the future stock returns. To explore this question on new, previously unstudied data, we introduce almost two centuries of Belgian data.
We focus on the Belgian stocks listed on the Brussels Stock Exchange from 1840 to 2018.[1] In general, the functioning of stock exchanges in the pre-World War I period was similar to today. The case for Belgium is interesting because it was one of the leading economies in the 19th century, with one of the largest stock exchanges in the world, in terms of market capitalisation. In fact, the market capitalisation of the Brussels Stock Exchange exceeds the country’s GNP in the period before World War II.
In this article, we focus on the question “does a yield curve inversion contain information for expected stock returns?”. We define the yield curve as the difference between long-term (10-year bond maturity or older, depending on liquidity in the 19th century) and short-term government debt (either the money market rate or the Belgian risk-free rate). If the difference between long and short-end yields turns negative, we have a yield curve inversion.
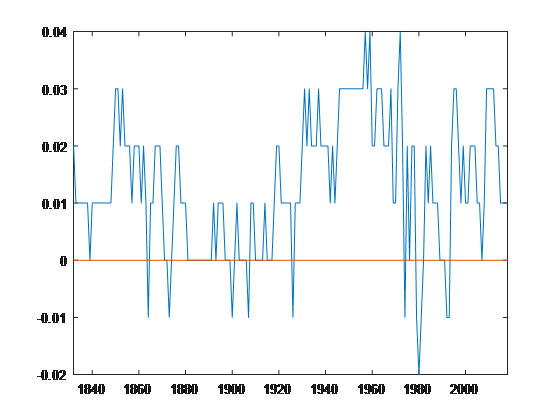
Over 178 years, we have 11 years of yield inversion, as shown in the graph.
To study the data, first, we separate the history into periods with yield curve inversions and “other periods” using a regime-switching model. At first glance, it appears that Inverted Yield curve, is a significant predictor of future stock returns.
1840 – 2018
Next, to explore statistical robustness of the Yield Curve as a predictor, we run two different regression models inside both periods.
First, to establish a base-case forecasting model, we use dividend yield as a predictor for expected returns, since this is the most theoretically appealing model.[2]
Second, we use inverted yield curves as the predictor for the one-year ahead return and dividend growth — which is the alternative hypothesis.
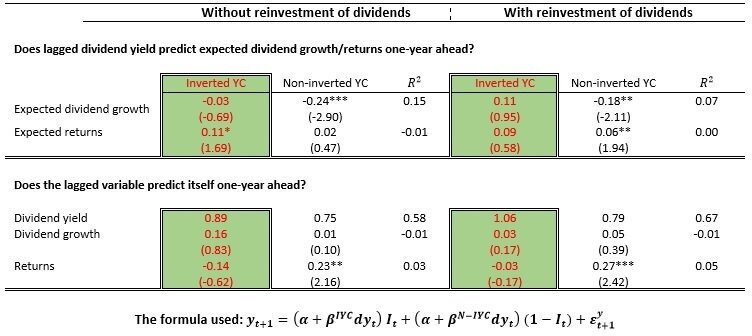
In general, we expect a positive relationship between dividend yield and expected returns. The increase in dividend yields, with constant dividend growth, comes from the drop in prices (which is equal to a surge in expected returns). In turn, there is a negative relationship between dividend yields and dividend growth. If future dividend growth increases, stock prices today will surge. Since dividend yield uses current dividends divided by stock price, dividend yield decrease due to the increase in stock prices. In this table, we do not take a stance on how we use dividends received within the year. Hence, we apply a reinvestment strategy and focus on dividends that are not reinvested.
The first table below shows results from the first regression capturing some interesting insights.
First, in times of yield curve inversion, there is only modest evidence of return predictability using dividend yields (0.11 with a t-statistics of 1.69). Since (expected) returns contain a lot of noise, we do not attach too much weight to this finding. In particular, since the evidence does depend heavily on the reinvestment of dividends received within the year. When we do not reinvest dividends, there is no return predictability evidence statistically significant from zero detectable.
Second, there is no time-series momentum effect in stock returns following a year of yield curve inversion. In contrast, during the “normal times” (i.e. when the yield curve is upward sloping), there is evidence of time-series momentum. That is, an increase in stock returns has a positive significant effect on stock returns one-year ahead.
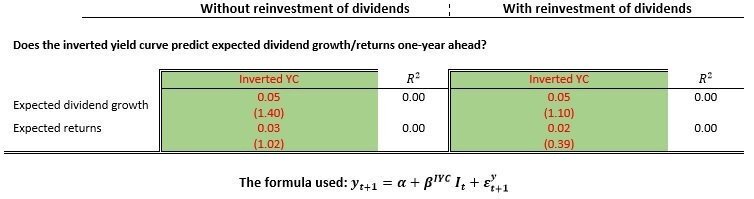
The results from the second regression are summarised in the table below. We target the information directly from the yield curve itself without relying on dividend yields. Although the coefficient is positive, it has no statistical significance. A yield curve inversion does not appear to lead to negative one-year ahead stock returns. This conclusion, is in line with the recent paper by Fama and French (2019), who showed there is no reason why investors should be worried by an inversion.[3]
What are my take-aways?
When we look at 178 years of data on the Brussels Stock Exchange, Yield Inversions have happened eight times, for a total period of 11 years excluding the current inversion.
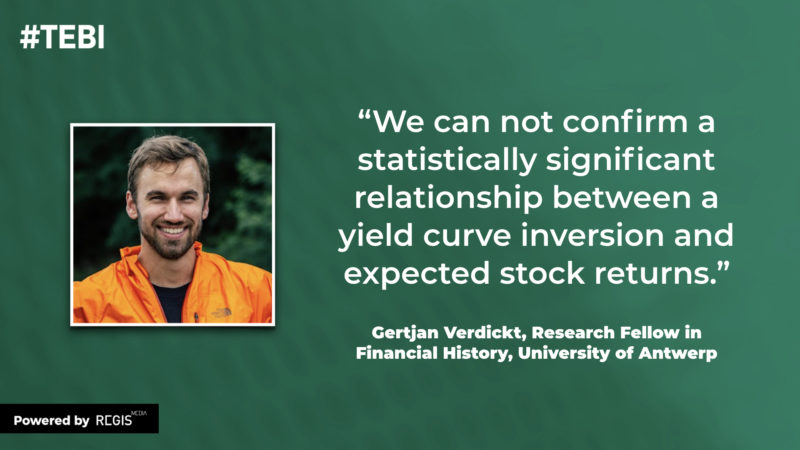
While average returns do appear lower following yield inversions, because of the high variability of outcomes and a relatively small number of inversions, we can not confirm a statistically significant relationship between a yield curve inversion and expected stock returns.
Footnotes:
[1] All the data comes from the University of Antwerp, StudieCentrum voor Onderneming en Beurs (SCOB).
[2] Verdickt et al. (2019) provides an interesting read on the importance of dividend yield on dividend growth/return predictability in a financial history sense.
References:
Ang, Andrew, Monika Piazzesi, and Min Wei. 2006. “What Does the Yield Curve Tell Us about GDP Growth?” Journal of Econometrics 131(1–2):359–403.
Benzoni, Luca, Olena Chyruk, David Kelley, 2018, Federal Reserve Bank of Chicago “Why Does the Yield-Curve Slope Predict Recessions?” SSRN
Campbell, John Y. 1987. “Stock Returns and the Term Structure.” Journal of Financial Economics 18:373–99.
Fama, Eugene, 2019, Dimensional
Harvey, Campbell, 2019, Research Affiliates
Lettau, Martin and Jessica A. Wachter. 2011. “The Term Structures of Equity and Interest Rates.” Journal of Financial Economics 101(1):90–113.
Verdickt, Gertjan, Jan Annaert, and Marc Deloof. 2019. “Dividend Growth and Return Predictability: A Long-Run Re-Examination of Conventional Wisdom.” Journal of Empirical Finance 52:112–27.
This article was first published on the Two Centuries Investments blog and is reprinted here with Gertjan Verdickt’s permission. You can find out more about his work via his website.
Related articles:
Do yield curve inversions tell us anything useful?
David Booth on AK47s and the inverted yield curve
Picture: Libby Penner via Unpslash