
By RICK FERRI
Mutual fund rating services divide mutual funds into categories based on their investment style. This helps investors compare the performance of one style to another and helps them compare the performance of individual funds in a particular style. While useful in many ways, this methodology can also create the illusion of superior performance when none exists.
Among the most familiar investment style tools is the Morningstar Style Box; a nine-square grid that provides a graphical representation of a fund’s investment style. For stock funds, it classifies funds according to primary market capitalisation (large, mid and small) and investment style (growth, core and value). Morningstar tracks the performance of securities in the nine style boxes, creates style indices, and then compares fund performance to these indices.
According to Morningstar magazine, the average actively managed US equity fund performance has fallen short of its comparable style box index in all nine categories over the past five years ending in June 2015. However, there are times when a majority of active managers appear to perform better than a style box index. Over the past three years, surviving large-cap value managers have fallen into this category by outperforming their benchmark index 62.7% of the time. See Figure 1 below.
Outperformance by a majority of managers in a particular style is often followed by calls from the fund community to use active management in that style. There are those who begin to argue that the market is inefficient in certain areas. They say indexing doesn’t work in these styles and that active management works better.
Don’t take these periods of active manager outperformance at face value. It is an illusion that is expected to fade over time. What’s actually occurring is the difference between pure style index returns and messy active manager returns.
Style indices represent a pure selection of securities driven strictly by empirical measurements, while fund managers are often messy in their portfolio constructions. For example, the only securities you’ll find in a small-cap value index are small-cap value stocks. In a small-cap value fund, a manager may choose to extend into other style boxes by drifting outside of the pure style. (The fine print in the fund prospectus typically allows for this.) A fund with messy style drift often compares favourably to the style it is benchmarked against when the benchmark is lagging other styles.
When enough fund managers in a category are messy in their stock selection, and the benchmark style performs poorly relative to adjacent styles, it creates a period when active style-drifting managers appear to be a better option for investors. This is a temporary illusion of superiority that is not expected to persist.
Figure 1 compares the three-year performance of Morningstar Style Box returns to the percentage of managers outperforming their style index benchmark. The X-axis represents the three-year annualised Morningstar style index return and the Y-axis represents the percentage of managed funds that outperformed each style.
Figure 1: Morningstar Style Box Performance and Percentage of Managers that Outperformed. Three years ending June 30, 2015
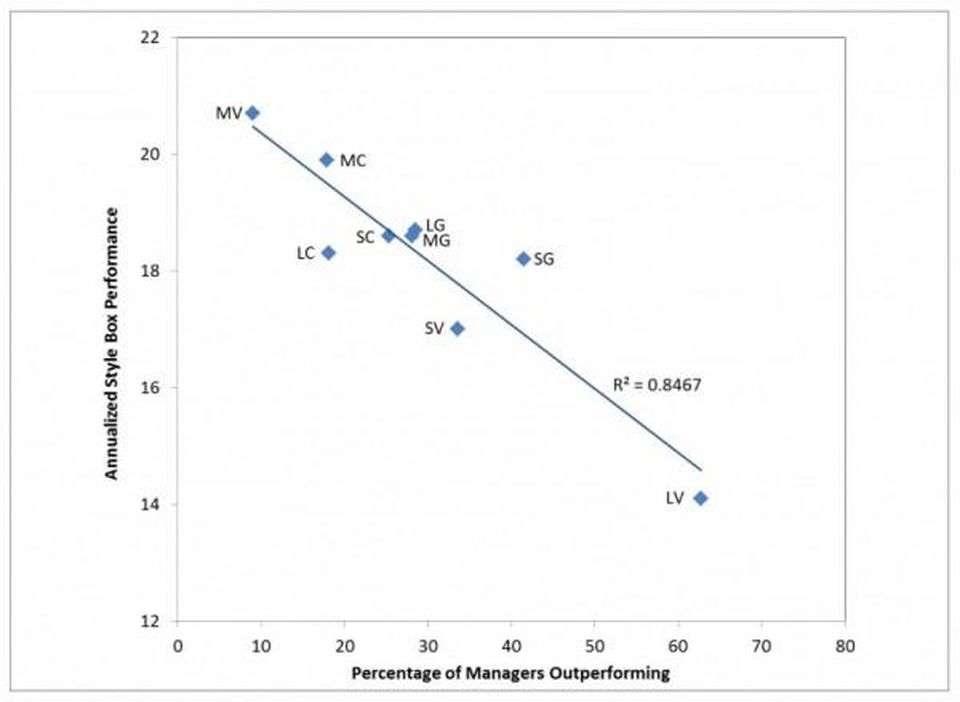
Source: Morningstar magazine, August/September 2015, chart and regression by R. Ferri
Figure 1 graphically illustrates the relationship between style performance and the ability of active fund managers to outperform the style. Mid-cap Value (MV) earned 20.7% annually and outperformed all other styles; MV managers had a very difficult time outperforming this index and succeeded only about 9% of the time. In contrast, Large-cap Value (LV) earned 14.1% annually and was the worst-performing style index; LV managers had an easier time outperforming, winning about 63% of the time.
The regression is close to 85%. This means the percentage of managers who outperformed in each style is highly correlated with the relative performance of the style index. The greater a style index outperforms adjacent styles, the fewer managers outperformed in that style and vice versa.
This observation isn’t new in mutual fund analysis. William Bernstein wrote about the phenomenon in 2001 article, Dunn’s Law Review: The Life and Times of “Core and Explore,” in which he noted, “The fortunes of indexing a particular asset class depend on its performance relative to other asset classes.”
The concept was expanded by William Thatcher in a 2009 article, When Indexing Works and When It Doesn’t in U.S. Equities: The Purity Hypothesis. Both articles indicate an inverse relationship between a style’s relative performance to other styles and active management’s ability to outperform in style.
This brings us to a couple of important questions. First, when do a majority of active managers outperform a poor-performing style? Second, can managers time styles and position their portfolios accordingly and make it worth investing in messy active funds?
Tables 1, 2 and 3 help answer the first question: When do a majority of active managers outperform a poor performing style? The yellow box with the red numbers in each table represents the percentage of managers that outperformed that style over a three-year period ending in June 2015. The red box represents the performance of the Morningstar style index for that category. The green box represents the performance of surrounding Morningstar style indices.
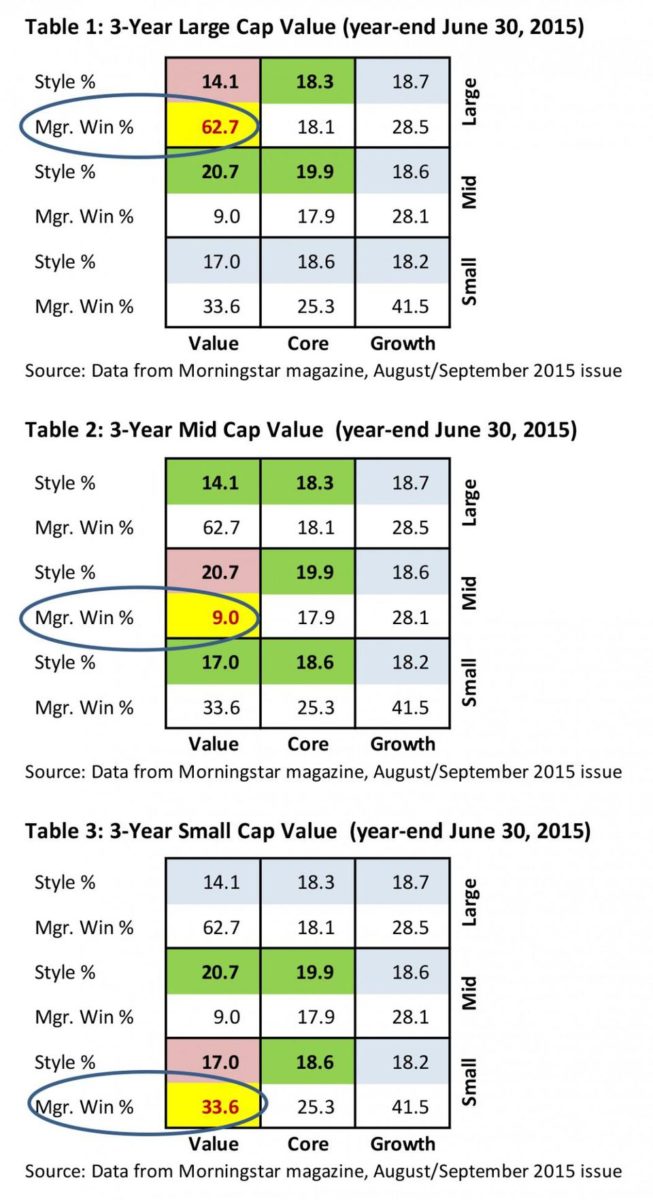
Table 1 indicates Large Cap Value (LV) managers had a great run over the three-year period ending June 2015. Almost 63% of active manager beat the Morningstar Large Value Index return of 14.1%. It’s easy to see why. The green areas in Table 1 represent the performance of adjacent styles indices: Large Core (18.3%), Mid Core (19.9%), and Mid Value (20.7%). All three had notably superior performance to Large Value. Any messy LV managers who invested outside of, but near the LV style index constituents would have added performance to their portfolio.
Table 2 shows the opposite story for Mid Cap Value (MV) managers. Only 9.0% outperformed their style index. MV was the highest-performing style of the nine style boxes, so any messiness on the part of MV managers would have hurt their performance relative to the style index – and it did.
Table 3 represents Small Cap Value (SV) managers, 33.6% of whom outperformed the Small Cap style index. Although the index performed satisfactorily at 17.0%, it underperformed the adjacent style indices, but not by as wide a margin as LV in Table 1. Accordingly, there was some benefit to active SV manages, but not enough to increase their win rate over 33.6%.
This latest evidence substantiates what Bernstein and Thatcher have indicated in the past: It appears there is no truth to the cliché that the market is inefficient in one style and not another. It’s about style performance relative to adjacent styles, and how messy managers are about remaining within a style in their equity selection.
Active fund managers look superior when their benchmark style performs poorly relative to adjacent styles, and they look bad when their benchmark style outperforms adjacent styles by a meaningful amount. Eventually, this all comes out in the wash. Active managers in every style have underperformed by about the same percentage.
The second question is easier to answer: Can active managers time styles and position their portfolios accordingly? They cannot. If they could, today’s Morningstar active versus passive results would show improvement since the time Bernstein wrote about it. But it has not. Managers do not appear to have persistent skill in timing investment styles.
Mutual fund rating services help investors compare the performance of one style to another by creating style indices, and they help investors compare the performance of funds within a particular style. But raw data can create the illusion of superior performance when none exists. You’ll need to dig deeper into a manager’s performance to determine if he or she truly has ongoing skill or if it’s just an illusion.
RICK FERRI runs Ferri Investment Solutions, a pay-by-the-hour financial advice service, and is based near Austin, Texas. You can follow him on Twitter @Rick_Ferri.
More articles by Rick Ferri on TEBI:
Points to consider when investing a lump sum
A radical way of staying the course
Six steps to staying the course