
Quality, the flip side of value
- Robin Powell

- Oct 15, 2021
- 6 min read
Updated: Nov 21, 2024

By LARRY SWEDROE
The existence of a quality premium in stocks that has been persistent over time, pervasive around the globe and robust to various definitions has been well documented by studies such as Buffett’s Alpha, Global Return Premiums on Earnings Quality, Value, and Size and The Excess Returns of ‘Quality’ Stocks: A Behavioral Anomaly. While there is no consistent definition of the quality factor (as there are with other factors), quality stocks typically have the following characteristics: low earnings volatility, high margins (profitability), high asset turnover (efficient use of capital), low financial leverage (little debt), low operating leverage (low fixed costs) and low specific stock risk. Those are the traits AQR Capital Management used to define their version of the quality factor: QMJ, or quality minus junk. Companies with those attributes historically have provided higher returns, especially in down markets.
The performance of quality and value stocks
Greg Obenshain, of the asset management firm Verdad, examined how quality performs on average, as well as how it performs relative to value. He began by noting: “One of the defining features of US stock performance over the past decade is the high quality of the best performers. The rapidly rising valuations of the high-flying tech stocks have been accompanied by incredible financial performance. These are not valuations underpinned by eyeballs, although there are some of those in the market as well.” To compare the performance of quality to the performance of value, he used a gross profit measure: gross profit to enterprise value (GP/EV).
Obenshain first compared the performance of quality and value across deciles over the period June 1996-June 2021:
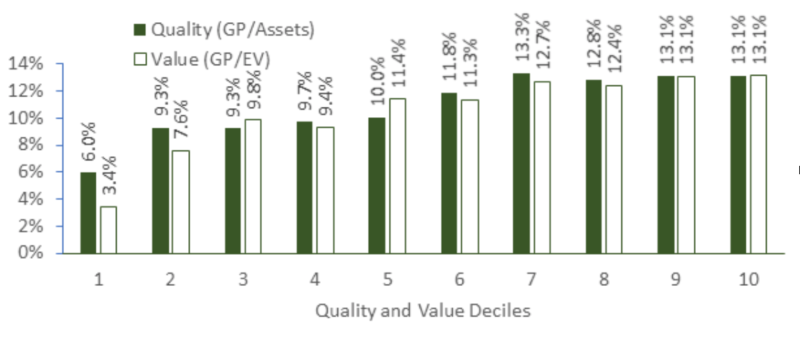

While he found that both factors worked about equally well (in terms of both absolute returns in the top deciles and how they spread returns across deciles), Obenshain also found that they performed very differently in terms of the factors worked well. The following chart shows the performance of the top minus bottom quintiles for the quality and value factors over the same 1996–2021 period:
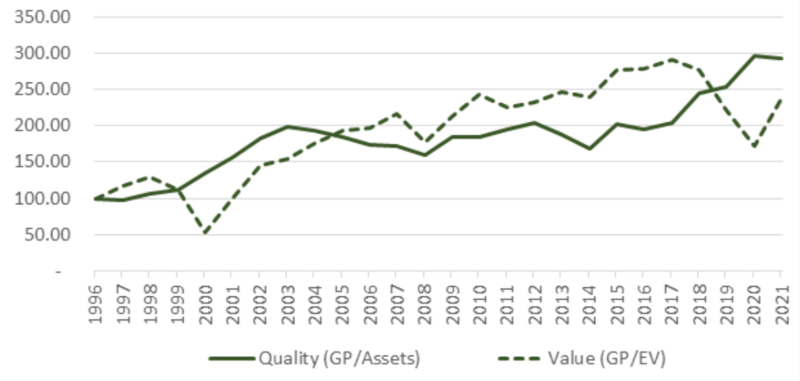

As the chart shows, while value did very poorly from 1997 through March 2000 and again from 2017 through 2020, it did phenomenally well in between those periods. On the other hand, while quality did well from 1997 through 2003 and 2017 through September 2020, it didn’t add much value during the period in between.
Using AQR data, we examined the relationship of the performance of value and quality over the longer period 1964-2020. We found that their correlation was just 0.10. And from the French data library, we found that the correlation of profitability and value was a similar 0.13.
Quality and value across the economic cycle
Obenshain next examined how quality and value performed relative to the four stages of the economic cycle: recovery, growth, overheating and recession. The chart, with data from French’s data library, shows the return of quality minus the return of growth and reveals a for value to outperform during recoveries and growth periods, while to underperform in overheating and recessionary periods.
There are two key points to consider in reviewing the performance across the four economic regimes. First, with only 25 years of data, and carving the sample into four periods (an average of just 6.25 years of data) one should be very cautious about claiming anything reliably. Second, it’s important to note that the data reveals only tendencies. For example, quality outperformed growth by wide margins from 1997 through March 2000 and again from 2017 through September 2020, both of which were periods of economic growth, not periods of overheating or recession. And during the recession from March to November 2001, the Fama-French Value Research Index outperformed the Fama-French Growth Research Index by almost 8 percentage points (0.05 percent versus -7.75 percent).
Different paths for quality and growth
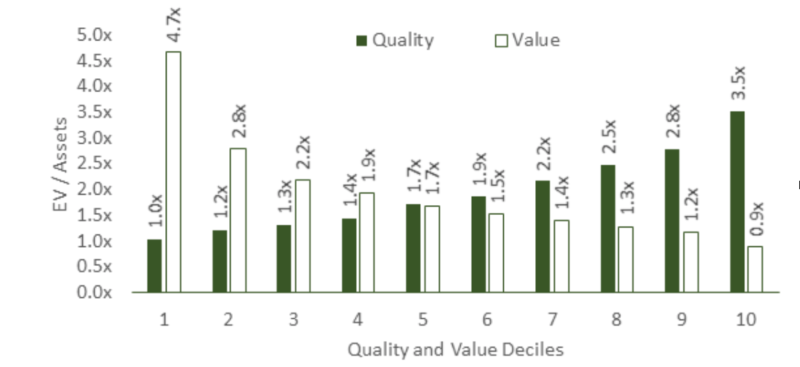
Obenshain then showed that the reason for the differences in the paths of returns for quality and value is because they tend to select very different stocks. Using data from S&P Capital IQ, he showed that while value selects companies with low asset multiples, quality selects companies with high asset multiples.
Given that quality and value are selecting different companies and delivering different return streams, Obenshain sought to determine the mechanisms through which the returns are realized by decomposing them to the top decile for quality and value. He found that the main driver (almost three-quarters) of the return to quality was asset growth, with profitability actually declining. In addition, despite profitability declining (subtracting 2.4 percent from returns), multiples increased (adding 3 percent to returns), offsetting the negative impact of declining profitability. In other words, quality companies deliver higher returns mostly by getting bigger. On the other hand, the main driver of returns to value was a change in multiples (about 62 percent of the return). Asset growth contributed 1.6 percent to returns, sufficient to offset the -1.0 percent impact from reduced profitability. Other factors (leverage impacts, debt paydown, change in shares and distributions) contributed 4.5 percent to value returns.
Investor takeaway
Obenshain concluded: “Value is the race car, hard to beat, but prone to accidents around the curves. Quality loses to value much of the time but is much more consistent and performs better when growth slows.” Unfortunately for investors, there are no crystal balls that allow us to foresee which economic regime is on the horizon. And as we have seen, even if we had that clear crystal ball and had foreseen good economic growth in the periods 1997-March 2000 and 2017-September 2020, growth rallies led to the two largest value drawdowns in history.
The conclusion investors should draw is that diversification across multiple sources of unique risk is the prudent strategy, and patience and discipline are required because all risk assets (and factors) go through long periods of poor performance. That’s not a reason to run away from risk. Instead, it is a reason to diversify across different sources of risk. As you have seen, while value did very poorly in the two periods of growth rallies, it dramatically outperformed quality over the much longer period 2003-2016. As another example, while the S&P 500 Index dramatically outperformed value stocks from 2017 through September 2020 (61.7 percent total return versus -2.7 percent total return for the Fama-French Value Research Index), from 1966 through 1982, while the S&P 500 Index provided a total return of 206 percent (underperforming riskless one-month Treasury bills, which returned 208 percent), the Fama-French Value Research Index returned 771 percent, an outperformance of 563 percentage points! (See disclosure).
Summarising, the evidence suggests that quality is an important characteristic for investors to consider, as well as cheapness (value). Thus, investors should consider including exposure to both in their portfolio design.
Postscript: Indirect exposure to quality through value strategies
While some value strategies use the single metric of P/B (price-to-book) to determine value, others include other metrics, such as P/E (price-to-earnings) and P/CF (price-to-cash flow).
The metrics that include earnings-related measures provide exposure to the profitability factor (and the related quality factor). For instance, since 2013, Dimensional’s value funds use not only P/B but also a measure of profitability in their portfolio construction design.
AQR’s value funds, in addition to using P/B, also use P/E, P/CF, price-to-forecasted earnings and sales-to-enterprise value. Bridgeway’s value funds also use multiple metrics, including P/E and P/CF. In other words, one can gain exposure to profitability and quality indirectly through investments in value funds that use metrics other than P/B.
For example, using the regression tool at Portfolio Visualizer and AQR’s four-factor model (beta, size, value and momentum) plus quality (QMJ), from inception in September 2011 through August 2021, Bridgeway’s Omni Small-Cap Value Fund (BOSVX) had a 0.48 loading on the QMJ factor. Similarly, over the period 2013 (when Dimensional began screening for profitability) through August 2021, the Dimensional U.S. Small Cap Value Fund (DFSVX) had a loading of 0.52 on QMJ. And from 2014 through August 2021, AQR’s Small Cap Multi-Style Fund (QSMLX) had a loading of 0.40. The newer Avantis Small Cap Value ETF (AVUV) had a loading of 0.53 on QMJ from inception in October 2019 through August 2021.
© The Evidence-Based Investor MMXXIV. All rights reserved. Unauthorised use and/ or duplication of this material without express and written permission is strictly prohibited.


