
By SHERIFA ISSIFU
2022 was the worst year for U.S. equity indices since 2008’s Global Financial Crisis, with the S&P 500 entering a bear market and declining 18% in 2022. Despite the market blues, there were some relative winners: the S&P DJI U.S. Core Indices beat their MSCI counterparts last year, driven by differences in their methodologies. Below we examine the impact of index construction on performance, factor exposure and sector weights of the two index series.
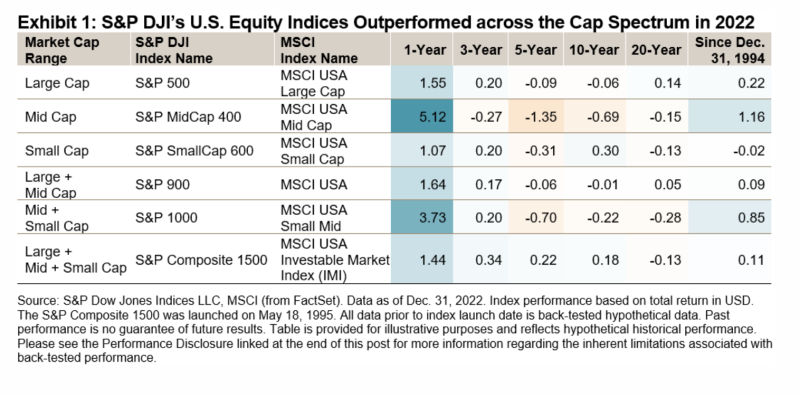
Exhibit 1 highlights that the S&P Composite 1500’s outperformance was both consistent and widespread in 2022, with S&P DJI U.S. Core Indices outperforming MSCI ACWI USA Indexes across all market capitalisation segments on average for three out of every four months in 2022. The outperformance ranged from 1% to 5%, with mid caps hosting the biggest performance differential — the S&P MidCap 400 beat the MSCI USA Mid Cap by 5%, its largest calendar year margin since 2016. Since Dec. 31, 1994, S&P DJI U.S. Core Indices beat MSCI ACWI Index in most cap-ranges.
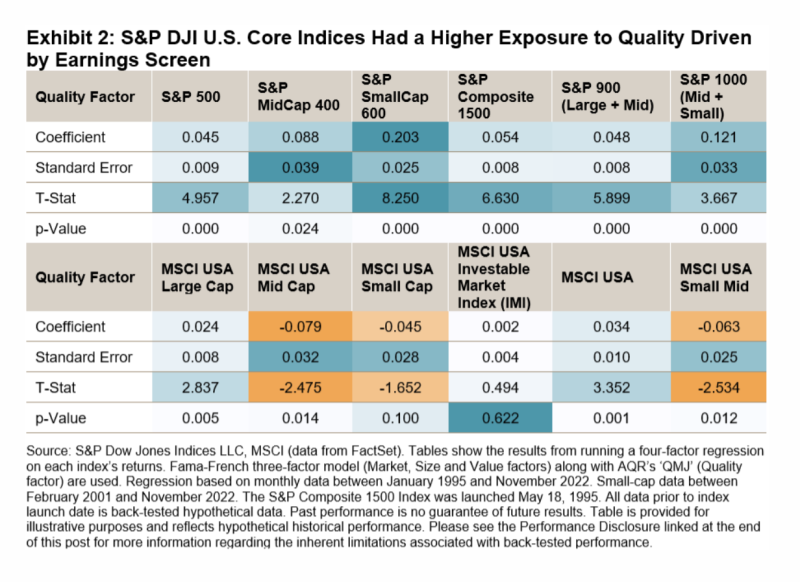
Differences in index construction have meant that S&P DJI indices have historically had a higher exposure to the quality factor than their MSCI counterparts. For example, the S&P Composite 1500 requires, among other criteria, potential new index additions to have four consecutive quarters of positive earnings to be considered for eligibility. The MSCI ACWI USA Indexes have no such requirements. This difference helps to explain why S&P DJI indices have a significant exposure to the quality factor, as shown in Exhibit 2.
Quality was a big differentiator in mid and small caps, with the widest spread between S&P DJI and MSCI quality scores in these size ranges. This difference is particularly acute in mid and small caps because firms are at an earlier stage in their lifecycle than large caps. It is typically harder for firms to reach the capitalisation of “large caps” without being profitable. The S&P Composite 1500 filters out lower quality stocks which has given the S&P SmallCap 600 and S&P MidCap 400 a quality premium compared to the MSCI USA SmallCap and MSCI USA MidCap, respectively. A robust earning screen has helped S&P DJI U.S. Core Indices outperform when quality is in favor and “junk” falls out of favour.
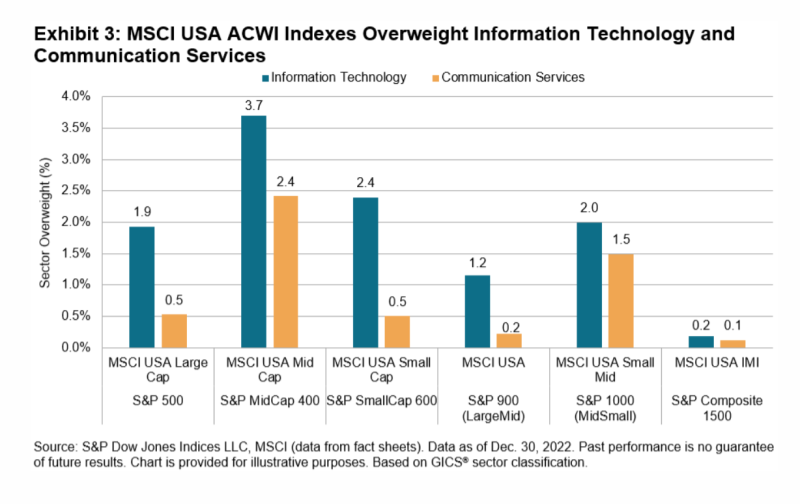
Sectors were also a major driver of performance in 2022, as the spread between best- and worst-performing sectors in the S&P 500 closed the year at 106%. The S&P 500 and S&P MidCap 400 both had a lower sector weight to Communication Services and Information Technology than their MSCI counterparts, explaining part of the recent outperformance given the material underperformance of technology-related sectors. The S&P 500 and MSCI USA Large Cap had a 26% and 28% weight to Information Technology, respectively. While I.T.’s mid-cap sector weight is about half of its large-cap weight, the spread in its weighting between benchmarks can vary more, with the MSCI USA Mid Cap having a 4% overweight versus the S&P MidCap 400, as shown in Exhibit 3.
While indices designed to measure the performance of U.S. equity market may look similar on the surface, especially in the short run, when you look more closely, differences in index construction can have a significant influence on performance, factor exposure and sector weights. It’s important to remember that it is often in the long run when quality shines through.
SHERIFA ISSIFU is an Index Investment Strategist at S&P Dow Jones Indices.
This article was first published on the Indexology blog.
PREVIOUSLY ON TEBI
11 things the SVB crisis tells us about investor behaviour
Keeping calm amid the banking crisis
Putting the improved performance of US active managers in perspective
HAVE YOU READ THIS BOOK?
Robin Powell and Jonathan Hollow have been friends since childhood and share a passion for helping people understand the world of money, savings, pensions and investments.
Now they’ve authored a book called How to Fund the Life You Want, which explains in plain English what you need to know to pay for the life you want to lead.
The book is published by Bloomsbury and is primarily written for a UK audience.
It’s available to buy on Amazon, on Bookshop.org, and in all good bookshops. There’s an eBook and an audio book version as well.
© The Evidence-Based Investor MMXXIII


