
Robin writes:
I’ve read several times lately that the traditional 60:40 portfolio — in other words, 60% equities and 40% bonds — is dead. If it’s true, that’s a major development. The 60:40 has been the bread and butter of portfolio construction for decades. But is it true that it’s dead, or at least dying?
I should clarify that the 60:40 split is neither here nor there. Investors with a greater capacity for risk will prefer, say, 70:30, 80:20 or even 90:10; more cautious investors may choose 40:60 or 30:70. No, the point is that, for a very long time, most portfolios have had a simple, two-way split between equities and bonds.
Those who now caution against that two-way split say we’ve entered a new era. Some talk of a pending “regime change” in the financial markets now we’ve moved in from Quantitative Easing and very low interest rates. Investors today, they suggest, need more complex strategies than those which worked in the past.
Who are these people calling the end of the 60:40 portfolio? Generally speaking they’re managers of active, strategic multi-asset funds. They “tactically allocate” the money they manage depending on where they see the greatest opportunities — and, of course, the biggest risks.
As a recent Morningstar study showed, the performance of these multi-asset funds has been appalling — so bad, in fact, that in the case of US multi-asset funds in the ten years to the end of April 2023, they “incinerated half investors’ potential returns” (Morningstar’s phrase, not mine).
In this article, ROY WALKER compares L&G’s Multi-Asset Target Return Fund — a very popular actively managed tactical asset fund here in the UK — with a simple, passive fund containing 45% equities and 55% bonds.
To clarify, neither Roy nor I have any axe to grind with L&G. Indeed I have a high regard for L&G and invested in its tracker funds for many years. But firms like L&G earn huge fees on these sorts of funds, and the question is, Are those fees really justified? Or are investors better off just keeping it simple, for a fraction of the cost?
This is a really important subject and, as always, we are be very interested to hear people’s views.
I came across an interesting article yesterday: “Why the 60/40 portfolio ‘should be dead” — a headline that’s an enticing piece of clickbait.
The head of multi-asset investing at Legal & General Investment Management (LGIM), John Roe, says that the 60/40 portfolio “should be dead”, which is a very confident and self-assured thing to say. Rightly so perhaps, because Mr Roe has oversight of both the multi-index range and the model portfolio service of LGIM. He’s a smart guy.
Poking around Citywire, I noticed that in additional to his other duties, Roe is co-manager of L&G’s Multi-Asset Target Return fund.
You can find information and factsheets about the fund here.
Here are some key details:
- Fund: Legal and General Multi-Asset Target Return Fund I Acc GBP
- ISIN: GB00BD97XY71
- Fund Size: £412m (as of 30/4/23 factsheet)
- Ongoing Charge: 0.65%
The fund is truly multi-asset, and the managers can select exposure to a huge range of assets including global equity, commodities, inflation linked securities, sovereign and corporate bond, and alternative strategies.
Factsheet snippets
Here’s what the fund’s factsheet says:
“This fund is designed for investors looking for income and growth through exposure to a diverse portfolio of investments with anticipated lower volatility than would be expected from a typical equity portfolio.
“Although investors can take their money out at any time, this fund may not be appropriate for those who plan to withdraw their money within five years.
“The fund is a Target Return Fund. This type of fund tries to increase the value of your investment over a period of time, in both rising and falling markets. However, there is no guarantee of returns.”
Sounds great! Let’s PIPS Benchmark it.
What’s a PIPS benchmark?
A PIPS benchmark is a simple rules-based index that can be used for assessing multi-asset funds. Although there are plenty of well-known indices used to benchmark single-asset funds, for example FTSE 100 or S&P 500, the situation is not the same for portfolios of different types of assets. The asset-management industry is mostly content to compare such funds against each other (the peer group), rather than use an independent benchmark.
PIPS indices are ‘Passive Index Portfolios’. It turns out that a simple two-index equity/bond portfolio makes an excellent benchmark for multi-asset funds. When looking at GBP-based funds, I suggest MSCI World index for equities, and Bloomberg Global Aggregate index for bonds (hedged to GBP). To distinguish from any other formulation, I call this ‘Walkers PIPS’.
Thus, ‘Walkers PIPS-GBP-60E’ simply means a passive rules-based 60/40 portfolio – 60% MSCI World and 40% Bloomberg Global Aggregate H-GBP. Rebalanced annually in January each year. It’s difficult to think of a simpler portfolio or more elegant benchmark for multi-asset funds. PIPS is independent of the peer-group, no human intervention is involved, and there’s decades of data.
There’s not just one PIPS benchmark – there are an infinite number, as we vary the equity/bond split from 0% equity (‘0E’) to 100% (‘100E’). Equities are generally more volatile that bonds, but with proportionately higher expectation of returns. So to benchmark a multi-asset fund using PIPS, first we determine what position to set the E/B dial to. This is easily done with a risk-return chart (a plot of volatility versus performance).
Choosing a suitable benchmark
In the chart below, we plot the L&G Target Return fund (the green dot) versus the PIPS-line (blue joined-up dots for the different E/B ratios) for a seven-year period (about long enough), to select a suitable individual index to use as benchmark.
We choose the “Walkers-PIPS-GBP-Index 45E” (the orange dot) as it has approximately similar volatility.
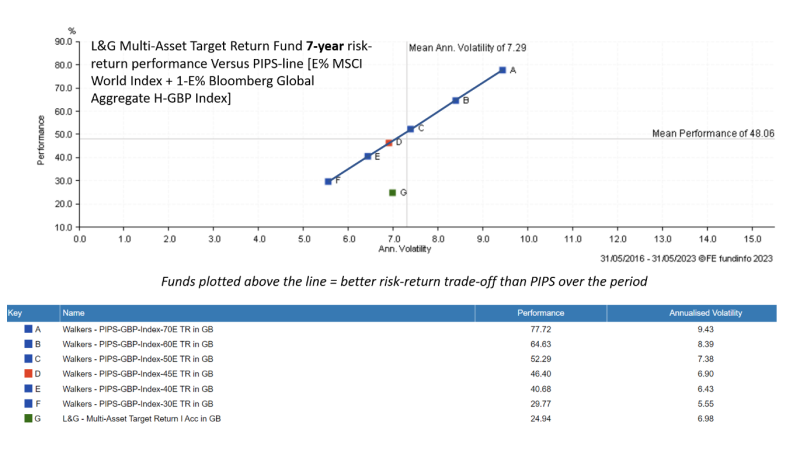
As indicated above a ‘45E’ PIPS benchmark is 45% MSCI World Index combined with 55% Bloomberg Global Aggregate Hedged-GBP, rebalanced annually. This is one of the simplest 45% Equity / 55% Bond portfolios possible.
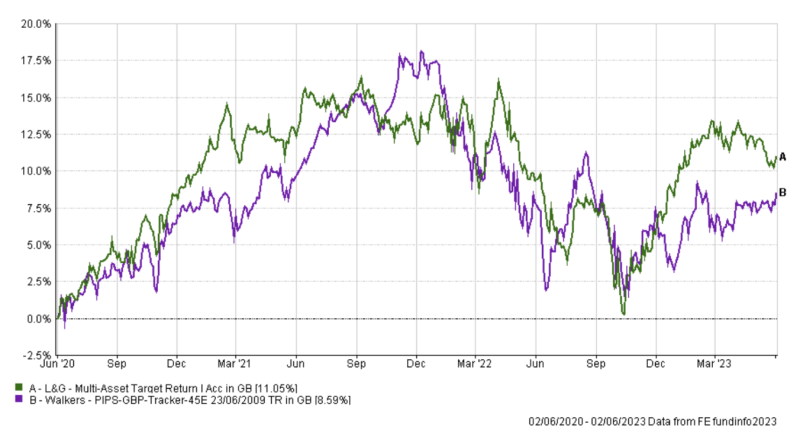
The chart below shows the relative performance of the L&G fund versus our selected PIPS benchmark, from start of data (although the “I ACC” share class launched in 2016, the fund itself launched in 2015).
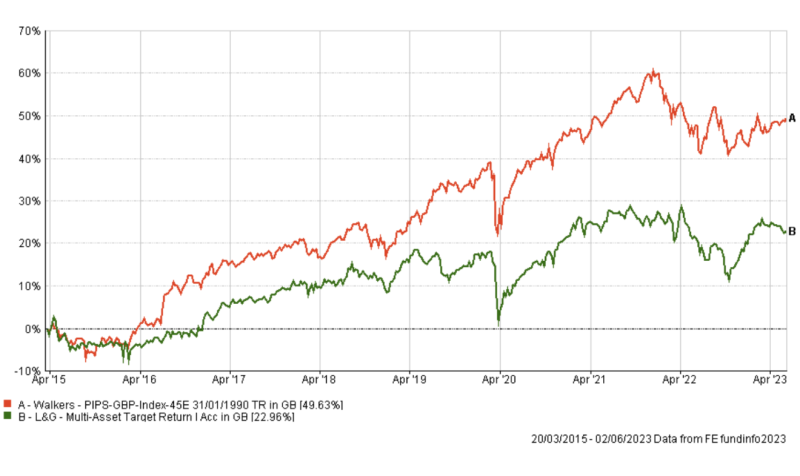
We see that the Legal & General Multi-Asset Target Return fund has not outperformed the PIPS benchmark. Note, this does not mean that the L&G Target Return is a bad fund, or unsuitable for any particular investor; but it helps confirm PIPS-GBP-45E as a viable benchmark, given the similar volatilities.
Diversification of the L&G fund
When I PIPS-benchmarked the Rathbones Strategic Growth fund last month, I noted that fund’s correlation with PIPS-GBP-55E was 0.91. However, in today’s analysis of the L&G Target Return fund, we see that the correlation with the PIPS-GBP-45E index is relatively low, at 0.58.
This is an important observation. The low correlation is likely due to the very wide range of different assets held within the fund, compared to just two simple equity and bond indices that comprise the PIPS-GBP-45E. Naturally enough. But, is it a good thing? Hold that thought.
From the L&G fund factsheet, listed under Risk Management is “Manage the overall volatility of the fund – between 6%-10% annualised over rolling three month periods”. The fund managers have truly exploited their access to the universe of global assets to achieve this. They break down the contribution to volatility of the individual assets and strategies. Here’s the list:
- Sovereign Bonds
- Credit EMD
- Decarbonisation
- Credit High Yield
- Artificial Intelligence
- Infrastructure
- China Developer Bonds
- Farmland & Wood
- Emerging Equity
- Commodity Curve
- EM Real Carry & Trend
- Equity Factors
- Multi Asset Trend
- Fixed Income Carry
- Currency Valuation
- Fixed Income Congestion
- Intraday Equity Momentum
- Equity Outright
- US Duration Forward Starting
- ZAR Local Bond
- Short IG Credit
- Short EURSEK
- EU Cyclicals vs Defensives
- USD vs HKD 5Y Swap
- T‑Note vs Canada
- Long Japanese Equities vs RoW
- Short EU 5Y5Y Inflation
- Plus 17 Other Strategies
This is an astonishingly diversified asset allocation. I am hugely impressed at the scale of resources and intellectual firepower that must be applied to handle this enormous shopping list of assets. No wonder the fund needs four managers. But with ongoing charges of up to 0.65% on £400m, I suppose they can afford to cover salaries for a nice team of staff.
What’s the deal with correlation?
Here’s why I think the low correlation between the L&G fund and a simple equity/bond portfolio is interesting. Certainly, the fund managers expertly demonstrate how asset diversity can be used to manage volatility. (Although we must remind ourselves that not all volatility is bad – we much prefer volatility in the upwards direction!) And in the referenced article, Mr Roe rightly says that for bonds and equities, “inverse correlation didn’t always happen.”
But a multi-asset fund has goals on two dimensions – volatility and returns.
Research shows that no matter how complex the asset allocation, and how smart the active management, by far and away the most significant determinant of a fund’s performance is overall market movement (approximately 80% in an important 2010 study).
Hence, a multi-asset fund that is diversified so much that it has low correlation to broad markets, potentially risks missing out on the long-run positive performance that markets have to offer.
Correlation refers to the tendency of assets to move in lock-step with each other. Hence, performance-wise, it may be significant that over a five-year period the L&G Multi-Asset fund has 0.58 correlation with global equities, whilst the PIPS-45E benchmark has shown 0.95.
Comparing the L&G fund with an investible PIPS tracker
Legal & General’s Multi-Asset Target Return fund is a real-world managed fund with fees and costs. Let’s compare performance versus an investible tracker of the PIPS-45E benchmark.
PIPS benchmarks are constructed from indices, so are not directly accessible. However, the constituents themselves are easily investible, allowing us to create a tracker for any PIPS index. A PIPS tracker is an investible portfolio of two low-cost index-tracking funds. Such an investment needs no intervention, other than rebalancing once a year (resetting the percentages in case of drift).
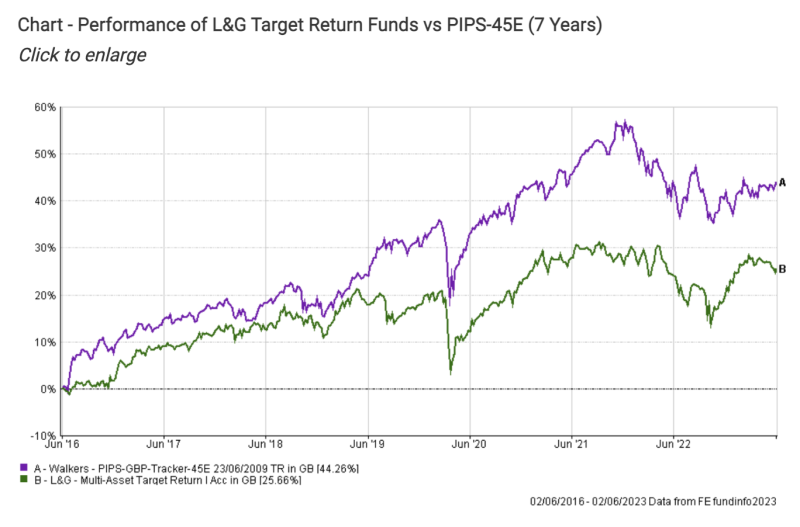
One implementation of a “Walkers-PIPS-GBP-Tracker-45E” would be 45% iShares MSCI World UCITS ETF plus 55% Vanguard Global Bond Index fund H-GBP.
Here’s a chart for seven years performance, below (reminder, charts are ‘total return’, i.e. dividends reinvested). Over this period, a DIY investor holding only one equity fund and one bond fund would have outperformed the L&G Target Return fund by 18%, for the same volatility (PIPS tracker std.dev.=7.09; L&G fund std.dev.=6.98).
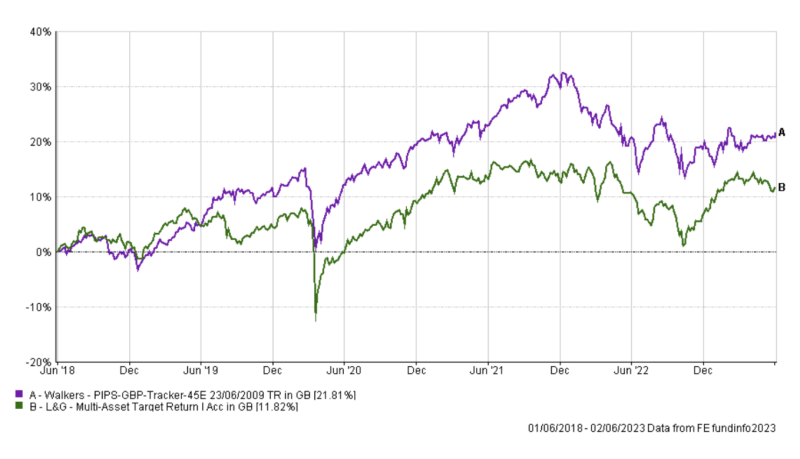
Below is the five-year performance chart. Over this period, a DIY investor holding only one equity fund and one bond fund would have outperformed the L&G Multi-Asset Target Return fund by 10%, for the same volatility (PIPS tracker std.dev.=7.79; L&G fund std.dev.=7.78).
Below, the three-year performance chart. Over this period, our DIY investor holding only one equity fund and one bond fund would have underperformed the L&G Multi-Asset Target Return fund by 2%, with somewhat more volatility (PIPS tracker std.dev.=7.85; L&G fund std.dev.=6.64).
An actively-managed multi-asset fund outperforming it’s benchmark in the shorter term, but underperforming in the long run, is in line with equivalent findings in the single-asset world (per SPIVA). Over longer periods of observation, fewer funds outperform their benchmark index. (We also note the L&G fund factsheet itself suggests investors should have a minimum 5 years horizon.)
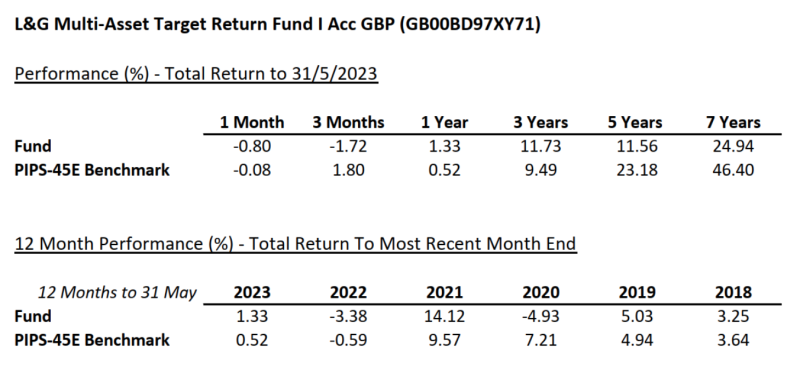
Performance comparison
As I mentioned earlier, in the multi-asset domain, it’s important that the benchmark is an independent and rules-based index (like PIPS). Not, the average of a peer-group, which the industry too often relies on. Below is the L&G Target Return fund performance in factsheet style.
COVID panic drawdown
“Managing volatility” is all very well, but how a fund or portfolio behaves in a major market downturn is important for most investors.
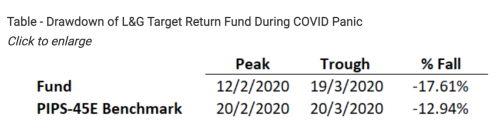
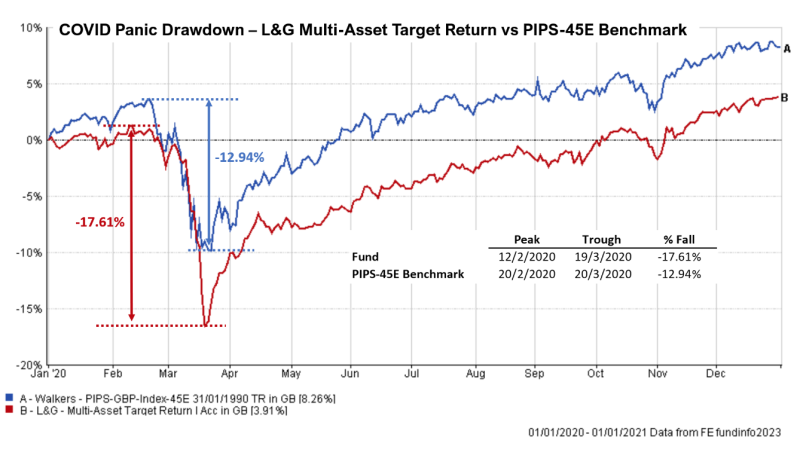
As the reality of the COVID crisis took hold, panic hit global stock-markets in February 2020. By how much did the L&G Target Return fund fall, peak-to-trough? How does that compare with the PIPS-45E benchmark?
Well, the PIPS-45E index fell by -12.94% in that period. Whereas, the Legal and General Target Return fund performed rather worse – falling -17.61%.
Fans of actively-managed multi-asset funds say that they can better protect investors’ capital during periods of volatility, because they can respond quickly to market conditions; plus, they have access to a huge range of assets to take defensive positions or exploit opportunities. There’s a certain comforting logic to these arguments, but their reliability is highly disputable.
Conclusion
Legal and General’s head of multi-asset investing, John Roe, says that the 60/40 portfolio should be dead. I’m certain that he says this in all sincerity. (And it goes without saying that the £millions L&G makes in management fees on their multi-asset range is completely unrelated.)
Notwithstanding the combined smartness of the L&G team, I disagree with Mr Roe’s assertion. (Whether for 60/40, 45/55, or any other point along the locus.)
1. The evidence says that the most substantial determinant of a fund’s performance is overall market movement. A rising tide lifts all boats.
2. Thus, capturing a fair chunk of market movement should be important when we think about constructing a multi-asset portfolio.
3. Control of risk is important to investors. But is cosmic-scale diversification the way to go? If we diversify too far away from ‘the market’, aren’t we likely to exclude ourselves from participation in long-term gains that the market gives away for free?
4. PIPS benchmarking shows that a simple portfolio of one broad market equity index, and one broad market bond index, provides a straightforward way to capture gains offered by the market, whilst managing volatility by turning the dial between equity and bonds.
5. For a DIY investor, this underlines the importance of having a well-chosen portfolio core, taking a long-term view, ignoring the urge to make changes for emotional reasons, and not mucking about with unnecessary diversification.
All performance data and charts from FEfundinfo, to whom we are grateful. Unless otherwise stated, charts and performance information are presented as ‘TR’ (Total Return), i.e. dividends reinvested.
IMPORTANT DISCLAIMERS
Analysis of retail investment funds contained herein is for education and information purposes only, and is not a suggestion that any fund is either suitable or unsuitable for an individual investor.
An investible tracker of a PIPS benchmark has many attractions, particularly as a portfolio core (or the core of a core), augmented by a small number of carefully selected satellite holdings. However, this article must not be considered a recommendation nor financial advice of any kind.
ROY WALKER is a financial and investment adviser based in the UAE. He’s had a long and distinguished career in the corporate world, mainly in the Far East. He now focuses on working one-to-one with private clients — particularly UK expats — and building their financial security. He holds an MBA with Finance from Imperial College London. You can find out more and contact Roy via his website, roywalkerwealth.com.
PREVIOUSLY ON TEBI
Think you’re an above-average investor? You may be overconfident
Is choice a blessing or a curse for active fund returns?
Three ways gratitude can improve your financial wellbeing
THE TEBI YOUTUBE CHANNEL
Have you visited the TEBI YouTube channel lately? You’ll find a wide selection of high-quality videos on there, and we’re going to be adding many more over the coming weeks and months. Why not subscribe so you don’t miss out?
© The Evidence-Based Investor MMXXIII


