
By BERLINDA LIU from S&P Dow Jones Indices
Over the 15-year period ending March 31, 2019, the biggest 25% of active large-cap equity funds managed about 90% of all the assets under management (AUM) held in active large-cap equity funds. This may suggest that investors’ fund selections skew toward larger funds. But is bigger always better? This topic has been widely debated: although larger funds may be able to hire more skilled fund managers and, in return, managers’ successful track records may attract more assets, one could also argue that smaller funds may face less liquidity constraints in security selection and can “move the needle” with relatively small investments. Size.
In this blog, we explore the effect of size — as measured by AUM — on active large-cap equity funds’ performance. Our study shows that, in the large-cap equity fund category, larger funds tended to take more risk and generate higher returns than smaller ones. However, their main advantage lies in higher survival rates over the long run, which contributed to their lower percentage of underperformance relative to the benchmark.
Over the 1, 5, 10, and 15-year horizons, we first rank all long-only active large-cap equity funds by their size at the beginning of the period and divide them into quartiles, with the first quartile being the largest and the fourth being the smallest. We then compare their returns, volatilities, survival rates, and ability to outperform the S&P 500®. To eliminate the confounding factor of equity capitalisation, we limit the universe to large-cap equity funds only. Fund returns are on a net-of-fee basis.
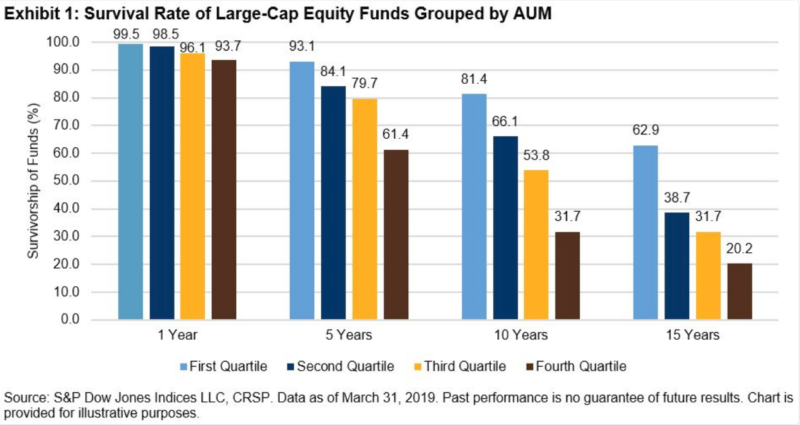
Larger funds were more likely to survive the market cycle than their smaller peers, especially over longer horizons (see Exhibit 1). Among the smallest 25% of funds (fourth quartile) that existed at the beginning of the 15-year study period, only 1 out of 5 survived the entire period compared with a survival rate of over 60% for the largest funds (first quartile) over the same period.
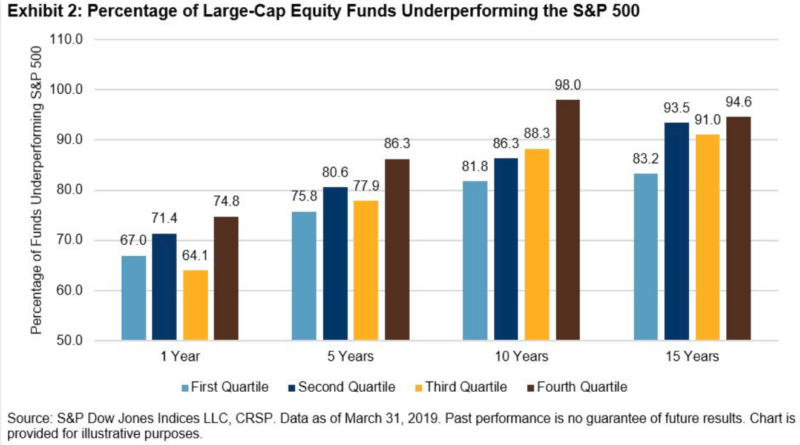
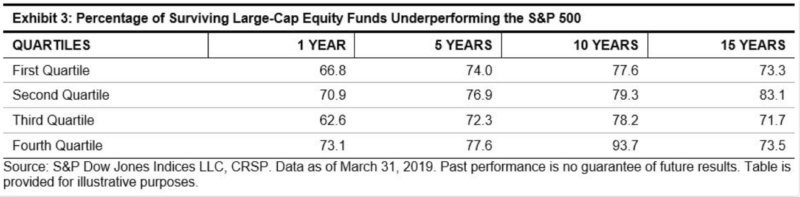
Larger funds also tended to fare better against the broad equity market (see Exhibit 2). For example, in the one-year period ending in March 2019, around a third of first quartile funds beat the S&P 500 compared with only 25% for fourth quartile funds. This difference became more pronounced over longer horizons; the low survival rate among smaller funds helps to explain this result given we assume dead funds underperformed the benchmark. In fact, if we account only for funds that have survived the 15-year period, about 73% of funds in the first quartile and fourth quartile underperformed the benchmark (see Exhibit 3).
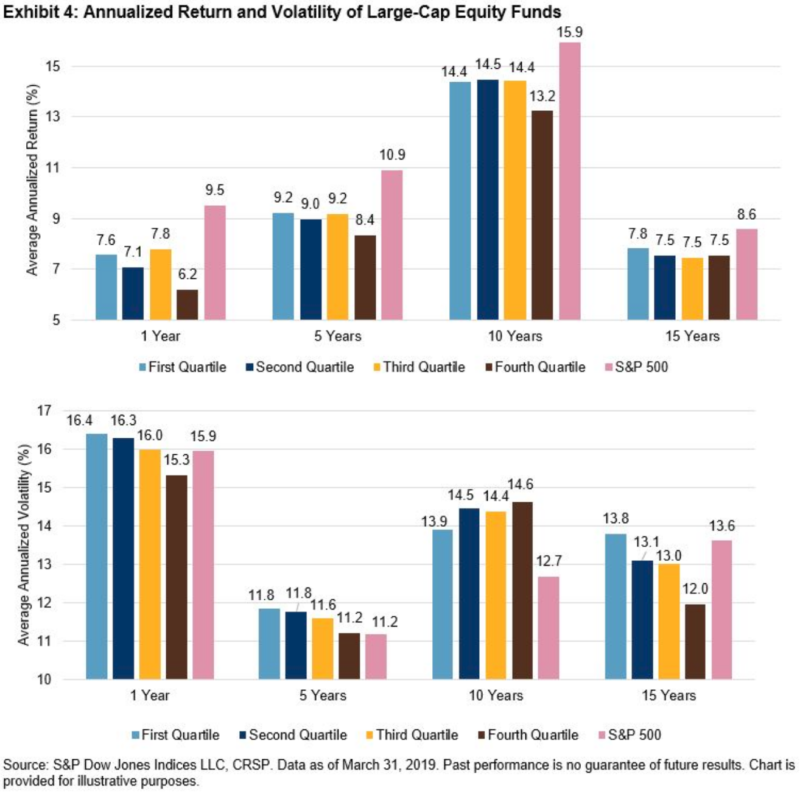
We next calculated annualised returns and volatilities of all the surviving funds (see Exhibit 4). On average, larger funds showed higher returns and took higher risk than the smaller funds in the 1-, 5-, and 15-year periods. However, this tendency gradually diminished over longer time horizons: the largest funds generated 30 bps of extra annualised returns compared with the other three groups over the 15-year horizon. The 10-year returns and volatilities indicated that large funds were more conservative than their peers during the 2008 financial crisis and its subsequent recovering period.
The third quartile funds (i.e., the second smallest fund group) showed comparable and sometimes even higher returns than the largest ones. This may help to explain why third quartile funds sometimes performed better against the S&P 500 than the other three groups (see Exhibits 2 and 3). Interestingly, these funds did not take extra risk compared with the largest ones.
This article was for first posted on the Indexology Blog and is republished here with the kind permission of S&P Dow Jones Indices.