By HAYDN MARTIN
The fact that equity markets return some set percentage, and will continue to do so in the future, has been almost accepted as a fact akin to the theory of evolution or Einstein’s ideas about relativity. You will often see “the market has historically returned 7% per year” or “the market returns 8-10% per year” or “investing in stocks will get you at least 5% real return in the long run” or lines to this effect.
Are these numbers accurate?
You would think it would be easy to establish the long-run historical rate of return for equity markets: just look at the records and calculate the average. Easy.
However, looking at academic research, it doesn’t seem to be that straightforward.
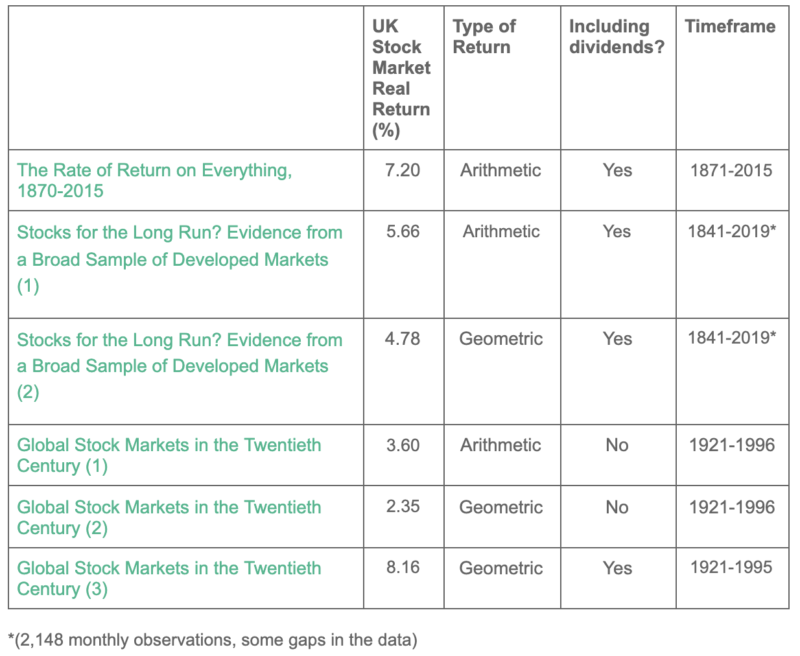
Let’s look at three papers, all concerning themselves with the long-run rate of return of asset classes. Focusing on UK real return (that is, taking inflation into account), for example, we seem to have some disagreement:

What is happening here?
Well, there are several distinctions between these numbers that result in different outcomes:
Compounding. Some returns are listed as arithmetic returns, meaning that they are a simple average of the returns for the period. Some returns are listed as geometric or compound returns, meaning the returns the investor would actually by investing their money for the period.
Dividends. Some returns take dividends into account (total return) and some do not (price or capital return).
Timeline. These papers, and all other sources, will be focused on different time horizons. Because of the relatively small number of observations and the nature of the distribution of equity returns, this results in sometimes markedly different numbers for the same country.
Data sources. There are several different ways of calculating returns. Researchers must deal with breaks in trading, hyperinflation, etc. There are also different sources of data to calculate returns from, leading to different results.
Compound total return
We want to focus on real compound total return, as this is the return the investor will receive by buying and holding a total return index. This still leaves timeline and data source uncertain.
You may assume that time horizon shouldn’t make much difference and that we’re splitting hairs by emphasising it. This is not true. Consider the compound real return of Belgium. According to these papers, this was 12.9% when considering the period 1970-1997 but only 2.67% for 1841-2019. That’s more than ten percentage points of difference in reported return.
Is a longer time horizon automatically more accurate? Not necessarily. In one sense we have more data so it would seem safe to assume yes. However, equity markets are not a laboratory experiment. More observations does not necessarily equate to a more accurate average because the system – markets – constantly changes and adapts. Think about how much the world has changed since 1870. Are observations from this time period really informative? It’s hard to say. An exclusive focus on the last 30 years might deliver more accurate results.
Thankfully, in the case of data sources, differences should produce smaller divergences in results. This is becoming increasingly true as all data moves online and different data outlets communicate with each other to sort out disagreements.
The future
If an accurate number for historical returns was determinable, what implication does this have for investors? Can we assume this rate of return as a given and act accordingly? Not quite.
Firstly, for logistical reasons. You are not investing for 200 years. You are (probably) not investing for 100 years. Your time horizon is shorter than this, so you might not experience the long-term return. You must also consider return-killers like taxes, fees, and unplanned liquidation.
Secondly, there is no compelling argument as to why these long-term returns should continue. Markets are complex creatures, adapting constantly (this is evident by the different returns over different time horizons). Unfortunately, it seems we simply don’t have enough data. The longest studies go back to 1840 – this sounds like a long time but consider this is only 180 observations of annual returns.
Returns have been loosely tied to the prosperity of the underlying companies. The prosperity of these companies has been loosely tied with the prosperity of the countries that they find themselves in. Those that have done well over the past 100 years (UK, US, Northern Europe, etc.) have had strong equity returns. Think of the US returning 6.42% to investors compared to Japan’s 3.66%. Or Australia’s 7.19% to Italy’s 2.06%. These are all over similarly-long time horizons.
Might economic prosperity of these recently-successful countries continue for another 100 years? Maybe. But then again, maybe not. It is difficult to imagine a world in which China, India, and Brazil are taking over the global economy but the stock markets of the UK, US, and Australia are still the best performers.
The US, in particular, has experienced remarkable equity returns. This has somewhat distorted the rhetoric on long-term retail investing, due to the extent that the US dominates content generally. A Portuguese investor would not have been as happy as a US investor following the advice of American commentators for the last 50 years.
What to do
Am I suggesting simply holding all your assets in a bank account (or in cash under your mattress)? No. Definitely not. Inflation will eat you alive.
Just make sure you’re globally diversified. And remember: the long-term returns you’re likely to receive will never be more than an educated guess.
HAYDN MARTIN is a data scientist working in fintech.
PREVIOUSLY ON TEBI
How will the other Bond movie end?
Can machines identify winning fund managers in advance?
Link’s role in Woodford fiasco laid bare in new book
Picture: Aron Visuals via Unsplash
© The Evidence-Based Investor MMXXI


