
By LARRY SWEDROE
Thematic investing can be defined as a “top-down” actively managed investment strategy, focused on predicting long-term structural and transformative trends (rather than on specific companies or sectors) that are expected to be dominant and important explanatory performance factors. David Blitz, author of the study Betting Against Quant: Examining the Factor Exposures of Thematic Indices published in the Winter 2021 issue of The Journal of Index Investing, examined the performance characteristics of the thematic indices of S&P and MSCI using the Fama-French five-factor asset pricing model (beta, size, value, investment and profitability).
Blitz began by noting: “The S&P thematic indices were originally created by Kensho, but were rebranded to S&P Kensho after S&P acquired Kensho in 2018. MSCI collaborates with ARK Investment Management for their thematic indices. Interestingly, both S&P/Kensho and MSCI/ARK use advanced machine learning techniques to identify the stocks that correspond to a certain theme.” His sample included all S&P and MSCI thematic indices with at least three years of data as of the end of April 2021 (36 S&P indices and 12 MSCI indices): “The number of stocks in the S&P thematic indices ranges between 13 and 86, except for the two composite indices which contain up to about 500 stocks. This stands in contrast with the MSCI thematic indices, which typically contain several hundred stocks. Only two MSCI thematic indices have less than 100 stocks (about 60 each), while half of the twelve indices even contain over 500 stocks. Another important difference is that the S&P thematic indices use equal-weighting as the starting point, while the MSCI thematic indices use capitalisation-weighting as the starting point.” The difference between equal- and cap-weighting results in significant differences in exposure to the size factor.
The data sample used included monthly return data for the S&P and MSCI thematic indices, which are available from June 2013 onwards for the indices with the longest return history. A large part of this history consists of backfilled data because the first S&P thematic indices were launched in 2016, while the MSCI thematic indices were launched as recently as 2020. Backfilled returns are likely to be biased upwards (because of survivorship bias). However, as Blitz noted: “Such biases are much less of a concern for estimating the factor exposures that are the subject of this study.” For indices that had a shorter history, he used the maximum available sample. Following is a summary of his findings:
- Almost all of the S&P thematic indices had a market beta above 1, with an average level of 1.21—the S&P thematic indices exhibit both elevated systematic risk and a sizeable amount of idiosyncratic risk. The MSCI thematic indices had an average market beta of 1.07 and also exhibit a significant, though lower level of, idiosyncratic risk.
- Thematic indices generally have strong negative exposures toward the profitability and value factors—they hold growth stocks that invest now for future profitability. The S&P thematic indices had an average value exposure of -0.64 and an average profitability exposure of -1.18. The MSCI indices had an average value exposure of -0.41 and an average profitability exposure of -0.57.
- Across all 48 thematic indices, only four had positive exposures toward the value factor, and only one had a (marginally) positive exposure toward the profitability factor—the thematic indices invest heavily in stocks with weak profitability and expensive valuations.
- The S&P thematic indices had an average exposure to the investment factor of just 0.07. However, the MSCI thematic indices had mostly negative exposures toward the investment factor, equal to -0.39 on average. Since the investment factor is value-like, this can be interpreted as additional anti-value exposure. Note that for firms with high profitability, high investment is a positive feature (as long as the return on investment exceeds the cost of capital). However, the MSCI indices have negative exposure to profitability. High investment with low profitability has not performed well historically.
- The exposures toward the momentum factor were close to zero on average, at -0.10 for the S&P thematic indices and 0.07 for the MSCI thematic indices.
- Most of the S&P thematic indices had large positive exposures toward the size factor, with an average size beta of 0.65. This finding can be explained by the fact that S&P uses equal weighting as the starting point for the construction of its indices. For the MSCI thematic indices, which use capitalisation weighting, the estimated size exposures tend to be much smaller, amounting to only 0.10 on average.
- Investors in thematic indices are effectively trading against quant investors, who prefer stocks that are currently cheap and profitable.
Blitz then hypothesised that if he assumed that the value and profitability factors of Fama-French have long-term annual premiums of 3 percent (in line with their historical long-term realized averages), this implies long-term expected average underperformances of 5.6 percent for the S&P thematic indices and 3.9 percent for the MSCI thematic indices. If we also consider the size factor (the size premium has not been statistically significant since its discovery 40 years ago), for which the thematic indices had positive exposure, the expected underperformance would be reduced to 3.6 percent for both the S&P and MSIC indices. (See the Postscript for a further discussion on the size premium.)
His findings led Blitz to conclude: “It is fair to say that the thematic indices generally resemble portfolios which are explicitly constructed to combine the worst profitability with the worst value/investment features.” He added: “By going short in key asset pricing factors, investors in thematic indices are trading against quantitative investors who seek long exposure to the same factors. From an asset pricing perspective this implies that investors in thematic indices face a low expected return.”
I would add that not only are they betting against the quants — betting that the factors that are short will not produce future premiums — but they are also making the explicit assumption that the market has mispriced the stocks in their indices (otherwise, there is no reason to overweight them in a portfolio). As the annual S&P Index Versus Active Scorecards (SPIVA) persistently demonstrate, the markets have not been kind to active investors working on that assumption.
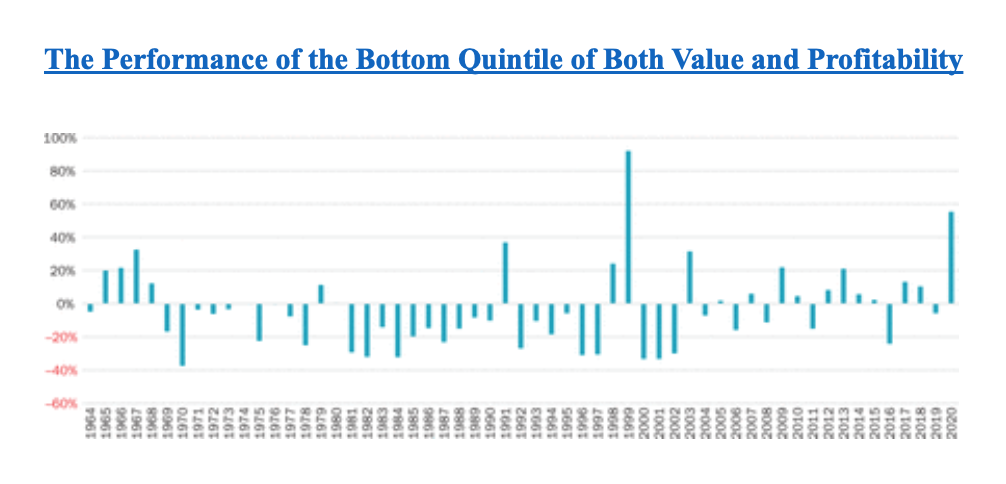
Investors should be aware that the kind of expensive, unprofitable stocks favoured by thematic indices were the big winners over the 2018-2020 period, as they were during the late 1990s. Thus, while such strategies have underperformed over the long term, there have been periods when such strategies have outperformed. Such periods provide investors with hope that “this time is different” (the four most dangerous words in investing).
There are also explanations for why investors might prefer thematic ETFs. As Blitz noted, investors have demonstrated a preference for lottery tickets (hoping to hit the home run) despite their poor performance on average. Blitz offered another possible explanation. He cited evidence demonstrating that ETF providers launch funds based on niche themes with strong recent performance, high media exposure and positive sentiment, appealing to retail and sentiment-driven investors. However, such funds tend to perform poorly after their launch. Thus, thematic indices may be primarily targeting retail investors, who are attracted to recent performance and appealing stories, instead of more sophisticated professional investors, who are familiar with asset pricing theory.
Investor takeaways
The historical evidence suggests that investors in thematic ETFs are likely to be disappointed, just as most investors in active strategies have been. With that said, for investors whose portfolios are tilted to the systematic value and profitability factors and have a particular interest in a thematic ETF, adding that exposure could provide a diversification benefit through the ETF’s negative exposure to the value and profitability factors. It could also help to dampen the volatility of their overall portfolio and reduce its tracking variance to the overall market, while acknowledging that they are betting against the quants and the historical evidence.
Postscript
Cliff Asness, Andrea Frazzini, Ronen Israel, Tobias Moskowitz and Lasse Pedersen, authors of the January 2015 paper Size Matters, If You Control Your Junk, examined the problem of the disappearing size premium by controlling for the quality factor (QMJ, or quality minus junk). They noted: “Stocks with very poor quality (i.e., ‘junk’) are typically very small, have low average returns, and are typically distressed and illiquid securities. These characteristics drive the strong negative relation between size and quality and the returns of these junk stocks chiefly explain the sporadic performance of the size premium and the challenges that have been hurled at it.”
The authors found: “Small quality stocks outperform large quality stocks and small junk stocks outperform large junk stocks, but the standard size effect suffers from a size-quality composition effect.” This led them to conclude that the challenges to the size premium “are dismantled when controlling for the quality, or the inverse ‘junk’, of a firm. A significant size premium emerges, which is stable through time, robust to the specification, more consistent across seasons and markets, not concentrated in micro-caps, robust to non-price-based measures of size, and not captured by an illiquidity premium. Controlling for quality/junk (the QMJ factor) also explains interactions between size and other return characteristics such as value and momentum.”
Further, Asness, Frazzini, Israel, Moskowitz and Pedersen found that “controlling for junk produces a robust size premium that is present in all time periods, with no reliably detectable differences across time from July 1957 to December 2012, in all months of the year, across all industries, across nearly two dozen international equity markets, and across five different measures of size not based on market prices.”
They also noted: “When adding QMJ as a factor, not only is a very large difference in average returns between the smallest and largest size deciles observed, but, perhaps more interestingly, there is an almost perfect monotonic relationship between the size deciles and the alphas. As we move from small to big stocks, the alphas steadily decline and eventually become negative for the largest stocks.”
Another important finding from the study was that higher-quality stocks were more liquid, which has important implications for portfolio construction and implementation.
The authors found similar results when, instead of controlling for the quality factor, they controlled for the low-beta factor—high-beta stocks (often referred to as lottery stocks) have poor historical returns. High-beta stocks also tend to be low-quality stocks. In addition, they found that small stocks have negative exposure to the newer factors of profitability (RMW, or robust minus weak) and investment (CMA, or conservative minus aggressive). High-profitability firms tend to outperform low-profitability ones, and low-investment firms tend to outperform high-investment ones.
Building on the findings of the above paper, Ron Alquist, Ronen Israel and Tobias Moskowitz, members of the research team at AQR Capital Management, also examined the impact of quality on the size effect in their May 2018 paper, Fact, Fiction, and the Size Effect. They found that the size effect was not statistically significant. However, they “save” the size effect by demonstrating that it is made much stronger (and implementation costs are reduced) when size is combined with the newer common factors of profitability, quality and defensive (low beta)—the return premium is greater for other factors in small stocks. Alquist, Israel and Moskowitz noted: “Controlling for quality resurrects the size effect after the 1980s and explains its time variation, restores a linear relationship between size and average returns that is no longer concentrated among the tiniest firms, revives the returns to size outside of January and simultaneously diminishes the returns to size in January—making it more uniform across months of the year, and uncovers a larger size effect in almost two dozen international equity markets, 30 where size has been notably weak. Thus, the size premium is much stronger and more reliable effect after controlling for quality.”
Building on their prior work, the research team at AQR dug deeper into the performance of small stocks in their September 18, 2020, article, “There Is No Size Effect: Daily Edition”, published in Cliff’s Perspectives. Again they found that while the size premium alone has not produced a statistically significant premium, it does work when combined with other factors (such as momentum, value and high quality) — those factors all have larger premiums in small stocks than in large stocks. In other words, the size effect can be resuscitated by building portfolios that combine it with other factors.
Motivated by AQR’s research, in their study Settling the Size Matter, published in the January 2021 issue of The Journal of Portfolio Management, David Blitz and Matthias Hanauer examined whether the size premium could be revived when controlling for quality versus junk exposures. They confirmed: “A highly significant alpha emerges in regressions of size on quality, but for international markets we find that the size premium remains statistically indistinguishable from zero.” They also found: “The significant regression alpha in the US is entirely driven by the short side of quality. Altogether, these results imply that size only adds value in conjunction with a short position in US junk stocks.” Their findings led them to conclude that while size is a weak stand-alone factor, small-cap exposure is vital for unlocking the full potential of other factors, such as value and momentum.
These research findings are problematic for the thematic ETFs examined by Blitz because while they have exposure to the size effect (which has not been statistically significant), they have negative exposure to the factors that have provided premiums.
For informational and educational purposes only and should not be construed as specific investment, accounting, legal, or tax advice. Certain information is based upon third party information and may become outdated or otherwise superseded without notice. Third party information is deemed to be reliable, but its accuracy and completeness cannot be guaranteed. The opinions expressed by featured authors are their own and may not accurately reflect those of the Buckingham Strategic Wealth® or Buckingham Strategic Partners®, collectively Buckingham Wealth Partners. LSR-21-202
LARRY SWEDROE is Chief Research Officer at Buckingham Strategic Wealth and the author of numerous books on investing.
ALSO BY LARRY SWEDROE
Should you avoid fund providers’ model portfolios?
What impact have new accounting standards had on quant funds?
Carbon beta: what it is and why it’s useful
OUR STRATEGIC PARTNERS
Content such as this would not be possible without the support of our strategic partners, to whom we are very grateful.
TEBI’s principal partners in the UK are S&P Dow Jones Indices and Sparrows Capital.We also have a strategic partner in Ireland — PFP Financial Services, a financial planning firm in Dublin.
We are currently seeking partnerships in North America and Australasia with firms that share our evidence-based and client-focused philosophy. If you’re interested in finding out more, do get in touch.
© The Evidence-Based Investor MMXXII


