
Initial public offerings, or IPOs, often attract considerable, both from the media and from investors. But as this article from DIMENSIONAL FUND ADVISORS explains, the long-term returns that IPO stocks deliver are often disappointing.
Initial public offerings (IPOs) often attract initial public interest—especially when familiar brands become broadly available to investors for the first time. In recent months, investors have had the opportunity to buy shares of ride‑hailing networks Uber and Lyft, workplace productivity services Zoom and Slack, and other high-profile businesses ranging from Pinterest to Beyond Meat.
News outlets contribute to the frenzy, building anticipation, tracking the early hours of trading, and casting judgment on the IPO’s success. Investors, perhaps lured by tales of outsized returns, try to get in on the action early.
New Dimensional research reveals the fundamental challenges IPO investors face. They may not be able to trade during the early hours, when the biggest price movements frequently occur. Lockup periods also often restrict when shares held by early investors can be resold on secondary markets, which can limit meaningfully the available liquidity in the first six to twelve months after an IPO. And medium‑term IPO performance is often underwhelming.
Dimensional’s Research team studied the first-year performance of more than 6,000 US IPOs from 1991 to 2018 and found they generally underperformed industry benchmarks. The researchers also found that known drivers of expected returns largely explain that underperformance.
Short-term IPO returns
Given that many investors may not be able to access these initial returns, Dimensional focused on the performance of IPOs in the secondary market. How do IPOs perform in their first year?
The sample for Dimensional’s study consists of 6,362 US IPOs that occurred from January 1991 to December 2018 and for which data is available.
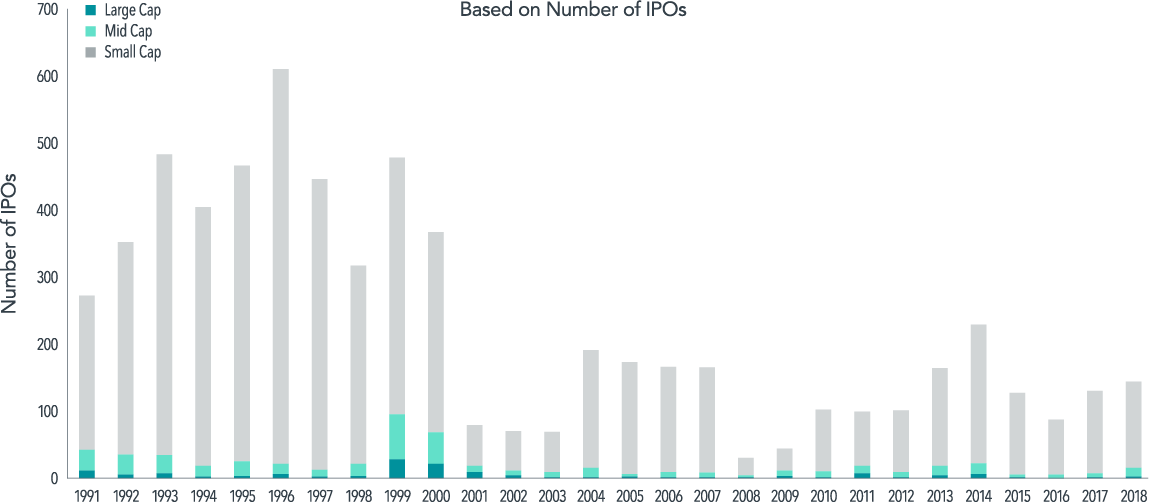
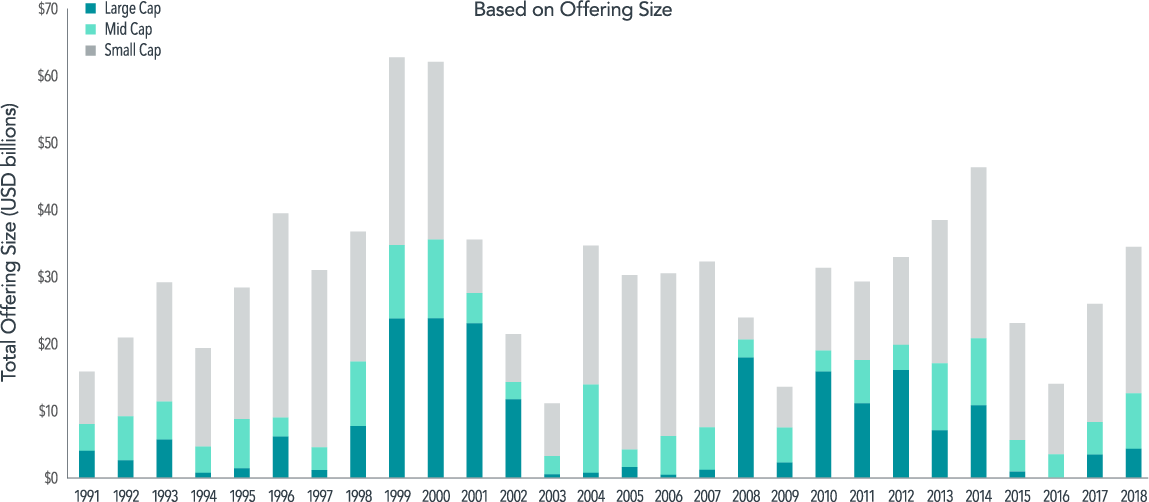
Exhibit 1 shows the annual frequency and market cap distribution of IPOs among firm size groups. The period from 1991 to 2000 is characterised by a relatively high IPO frequency rate of 420 per year and is followed by a less active 18-year period during which the rate falls to 120 IPOs on average per year. Although the number of IPOs has declined, the average IPO offering size is almost three times larger over the most recent period, as compared to the initial 10 years in the sample.
Most IPOs fall into the small cap size group, defined as firms that fall below the largest 1,000 US‑domiciled common stocks at the most recent month‑end. Large cap and mid cap IPOs represent 24% and 19%, respectively, of total capital raised through IPOs over the sample period.
IPO performance
Dimensional evaluated IPO returns by forming a hypothetical market cap-weighted portfolio consisting of IPOs issued over the preceding 12-month period, rebalanced monthly.4 This methodology excludes the initial first-day returns by design to alleviate the adverse selection problem inherent in the IPO allocation process.
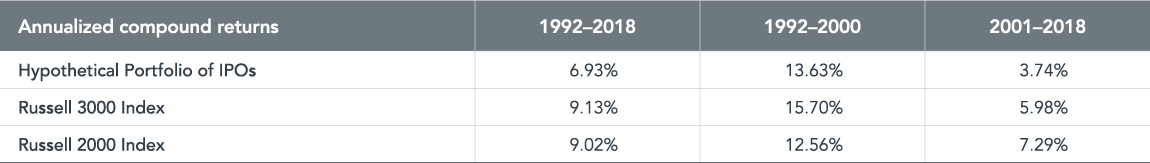
Exhibit 2 compares the returns of the IPOs to the returns of the Russell 2000 and 3000 indices over the full sample period as well as two sub-periods covering 1992–2000 and 2001–2018. IPOs underperform the Russell 3000 Index in both the overall period and sub-sample periods. For example, IPOs generate an annualized compound return of 6.93%, 13.63%, and 3.74% over the full, initial nine-year and final 18-year sample periods, respectively, as compared to 9.13%, 15.70%, and 5.98% for the Russell 3000 index over the same time horizons. In comparison to the Russell 2000 Index, the hypothetical portfolio of IPOs underperform in the overall period (6.93% vs. 9.02%) and the 2001–2018 (3.74% vs. 7.29%) sub-period and outperform (13.63% vs. 12.56%) over the period from 1992 to 2000.
Known drivers of returns largely explain the underperformance of IPOs. IPOs have underperformed the market because, as a group, they have behaved like small growth, low profitability, high investment stocks, which have had lower expected returns than the market.5
Summary
Investors considering IPOs should be aware of potential adverse selection and post-offering activities, such as the expiration of insider lockup periods. Investors should also understand that IPOs have generally underperformed broader market benchmarks in recent decades and that their fundamental characteristics suggest lower expected returns.
You may also find these related articles interesting:
How and why do IPO stocks behave differently?
How funds use IPOs to inflate performance