
By LARRY SWEDROE
The basic hypothesis of behavioural finance is that individual investors are not fully rational when making investment decisions — due to behavioural biases, they make costly mistakes. Two related biases are recency bias — the tendency to overweight recent events/trends and ignore long-term evidence — and loss aversion — the tendency to experience losses more severely than equivalent gains. Do these biases lead to mispricings and thus provide information as to the cross-section of returns?
The hypothesis is that because investors typically use past return distributions to form expectations of future performance, their perception of the past is distorted, leading to systematic biases in return forecasts—investors affected by recency bias will overestimate the probability of the most recent returns and underestimate the probability of distant values. If the recent returns were comparably high (low) relative to the distant ones, investors will overestimate (underestimate) future returns — leading to overvaluations (undervaluations). Mispricings are eventually corrected by arbitrage forces, driving the prices down (up) again.
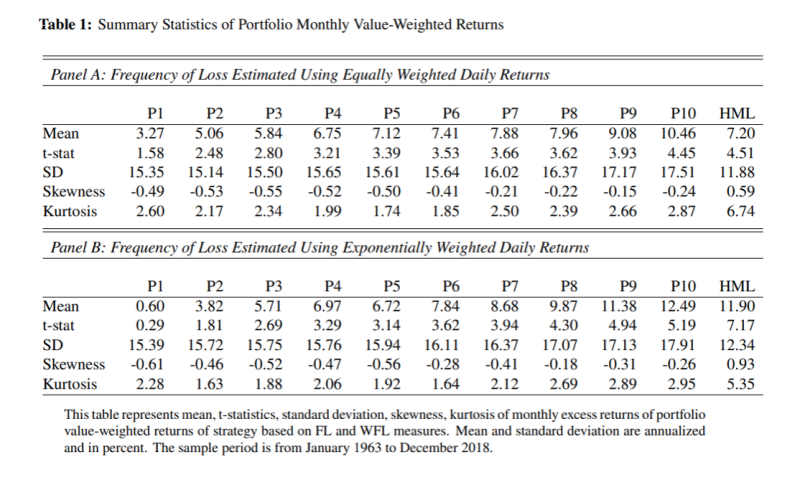
Borys Koval and Alina Steshkova sought to answer the question of whether these biases lead to mispricings and thus provide information as to the cross-section of returns in their August 2022 study, Do Investors Care About Negative Returns?” in which they investigated if the frequency (as opposed to the magnitude) of past negative returns (related to the “hot hand” fallacy) shapes investor expectations about future performance. Prior research had shown that investors are reluctant to hold stocks that show a high frequency of negative returns. Thus, they hypothesised that investors use simple heuristics and count the number of daily returns below zero when forming expectations about next-month returns. That led them to define frequency as the number of upward and downward movements in daily returns over the past month. They then created two measures: an equal-weighted measure of frequency of loss (FL) and a weighted frequency of loss (WFL) — the weighted frequency of the negative daily returns in the previous month, where the weights follow an exponential function, with more weight put on more recent observations. Their data sample included U.S.-based common stocks trading on the NYSE, AMEX and Nasdaq with end-of-month stock prices of at least $1, and spanned the period July 1963-December 2018. To ensure that results were not driven by micro-cap stocks, NYSE breakpoints were used for portfolio formation and data was winsorised at 0.5 percent and 99.5 percent. Following is a summary of their findings:
- The frequency of negative daily returns in the previous month predicted future monthly returns in the cross-section of stocks.
- Recent losses have a significant impact on the forecasting of future returns — both returns and volatility increased monotonically from the low-frequency to the high-frequency deciles. On the other hand, market beta, market cap (higher deciles were smaller stocks) and liquidity decreased monotonically from the low- to the high-frequency deciles.
- The FL strategy based on investing in stocks with the highest frequency of negative returns and simultaneously selling stocks with the lowest frequency of negative returns in the previous month unconditionally earned 7.2 percent per annum. However, the performance of the FL strategy was not robust to alternative empirical specifications.
- The WFL strategy returned 11.9 percent per annum and was robust to a variety of risk factors and firms’ characteristics—investors were rewarded for buying stocks with higher frequency of loss and selling stocks with lower frequency of loss.
- There was a positive relationship between the WFL measure and the cross-section of future stock returns controlling for a large set of explanatory variables (market beta, size, value, momentum and short-term reversal, profitability, investment, quality, liquidity, idiosyncratic volatility, skewness and Stambaugh’s mispricing factors) — a one-standard-deviation increase in the WFL measure led to about a 3.6 percent per annum increase in expected return, all else equal.
- The results were strongest for smaller and less liquid stocks, suggesting that limits to arbitrage help explain the anomaly. However, the results were robust to the exclusion of micro-cap stocks as well as to limiting the sample to stocks in the S&P 500. In fact, the return of the high-minus-low strategy was even higher for stocks included in the S&P 500 than for the total set of stocks.
- Short-term reversal best explained the results. However, accounting for that factor, the alphas were still significantly positive. For the WFL strategy, the annual alpha was a highly significant 7.56 percent (t-stat = 5.43). For the FL strategy, the annual alpha was a statistically significant 2.4 percent (t-stat = 2.23). These results suggest that an abnormal return of the FL strategy could not be fully explained by risk factors.
- The results remained statistically significant even if the rebalancing of the portfolio took place on an arbitrary day of the month.
- Since their measure was based on the counting of daily negative returns over the past month and not on the magnitude, the performance of their strategy could not be fully explained by momentum and short-term reversal.
- Their results became statistically insignificant or even reversed when three months of data were considered for portfolio formation, suggesting that only one month of daily data was relevant for the construction of their measure.
- Their results held for both individual and institutional investors (data covered the period January 1997-December 2018). However, the performance was stronger for stocks with a higher fraction of retail investors — for the quantile that included stocks with the highest WFL, the portfolio where retail investors were more active earned 0.56 per month (t-stat = 2.04) versus 0.19 percent per month (t-stat = 0.71) in the portfolio where the fraction of institutional investors was the greatest. The results indicate that retail investors are more subject to behavioural biases.
Their findings led Koval and Steshkova to conclude: “The superior performance of the WFL strategy compared to the FL strategy indicates that not only the frequency but also the timing of daily negative returns over the previous month is important.”
Consistent findings
Koval and Steshkova’s findings are consistent with those of Nusret Cakici and Adam Zaremba, authors of the 2021 study Recency Bias and the Cross-Section of International Stock Returns. They calculated a chronological return ordering (CRO) variable. Low CRO numbers indicated relatively low distant returns and high recent payoffs, while high CRO values indicated that the distant returns were comparably high and the recent returns were low. Hence, low CRO values should imply low future returns; conversely, high CRO scores should signal high future returns. They found that CRO had strong predictive value in global developed markets. For example, the value-weighted (equal-weighted) decile of stocks with the highest CRO outperformed the decile of stocks with the lowest CRO by 0.91 percentage point (0.63 percentage point) per month. They also found: “The chronological return anomaly is particularly pronounced in challenging market conditions: during high volatility states, following market crashes, severe bear markets, and during tight funding environments. This is consistent with the behavioural view on market anomalies; asserting that they should be the strongest during periods when arbitrage activities are limited.”
Koval and Steshkova’s findings are also consistent with those of Ji Cao, Marc Oliver Rieger and Lei Zhao, authors of the May 2019 study Safety First, Loss Probability, and the Cross Section of Expected Stock Returns. They hypothesised that investors would view loss probability (LP) as an important determinant of risk — when buying stocks, investors care about more than just volatility. Thus, LP should impact prices. Their measure of a stock’s LP in a given month was the fraction of the total trading days in the month with a return below the risk-free rate. Stocks with a high (low) LP have high (low) subsequent returns because of investors’ desire to avoid high LP stocks. They found that the difference between monthly returns on the equal-weighted (value-weighted) decile portfolios with the highest and lowest LPs was 0.88 percent (0.66 percent). The t-values were highly significant (t = 6.27 for the equal-weighted portfolio, and t = 4.88 for the value-weighted portfolio). On an equal-weighted basis, excess returns increased monotonically. On a value-weighted basis, the increase was nearly monotonic. And like Koval and Steshkova, they also found that returns were strongest among stocks that were less subject to arbitrage activities — such as small stocks, illiquid stocks and stocks with high idiosyncratic volatility.
Investor takeaways
The body of evidence we reviewed demonstrates the role of biases and the use of heuristics in financial markets. Specifically, we have seen that the sign of the return, not just its magnitude, is relevant for investors in their decision-making process. As a result of recency bias and loss aversion, and in line with the hot hand fallacy, the findings support the idea that the frequency of past negative returns influences the expectations of investors affecting future company performance — investor expectations about the fundamentals of a firm are distorted by the high frequency of recent negative returns that leads to an excessive selling of the stock. And the finding that the phenomenon is greater for the stocks that are mostly held by retail investors demonstrates that it can be related to investor sophistication — unsophisticated investors suffer more from recency bias and errors in the expectation formation process and tend to use simple heuristics when making investment decisions.
The key takeaway for investors is not to make the mistakes of recency bias and loss aversion, as the research demonstrates that companies with comparably low recent returns and high distant ones significantly outperform their counterparts (companies with relatively high recent returns and low distant ones). Investors should be particularly careful to avoid getting euphoric, because when something is highly popular, it runs the risk of being bid up in price and thus is prone to disappoint. Another takeaway is that avoiding checking the performance of your portfolio on a daily (or other high-frequency basis) can increase your risk of making behavioural errors. Simply adhering to your plan by rebalancing your portfolio will also help you avoid the mistakes caused by recency bias, loss aversion and overconfidence.
For informational and educational purposes only and should not be construed as specific accounting, legal, or tax advice. Certain information is based upon third party data which may become outdated or otherwise superseded. Third party information is deemed to be reliable, but its accuracy and completeness cannot be guaranteed. By clicking on any of the links above, you acknowledge that they are solely for your convenience, and do not necessarily imply any affiliations, sponsorships, endorsements or representations whatsoever by us regarding third-party websites. We are not responsible for the content, availability or privacy policies of these sites, and shall not be responsible or liable for any information, opinions, advice, products or services available on or through them. The opinions expressed by featured authors are their own and may not accurately reflect those of Buckingham Strategic Wealth® or Buckingham Strategic Partners®, collectively Buckingham Wealth Partners. Neither the Securities and Exchange Commission (SEC) nor any other federal or state agency have approved, determined the accuracy, or confirmed the adequacy of this article. LSR-22-362
LARRY SWEDROE is Chief Research Officer at Buckingham Strategic Wealth and the author of numerous books on investing.
ALSO BY LARRY SWEDROE
If you found this post interesting, you might also want to read these other articles that Larry has written about sustainable investing:
How a 52-week high hurts returns
Identifying winning funds ex ante: Is it possible?
The impact of ESG uncertainty on asset prices
What does a change in ESG rating tell us about future returns?
ESG investing: Is best-in-class the way to go?
OUR STRATEGIC PARTNERS
Content such as this would not be possible without the support of our strategic partners, to whom we are very grateful.
TEBI’s principal partners in the UK are S&P Dow Jones Indices and Sparrows Capital. We also have a strategic partner in Ireland — Biograph Wealth Advisors, a financial planning firm in Dublin.
We are currently seeking partnerships in North America and Australasia with firms that share our evidence-based and client-focused philosophy. If you’re interested in finding out more, do get in touch.
© The Evidence-Based Investor MMXXII


