
By FEI MEI CHAN and CRAIG LAZZARA
“Las Vegas is busy every day, so we know that not everyone is rational.”
– Charles D. Ellis
Low volatility investing gained immense popularity in the last decade. A proliferation of passive investment vehicles based on this concept attracted more than $70 billion in assets globally as of the end of February 2019.
The low volatility phenomenon is not, however, a new concept; academics first wrote about it more than four decades ago. Low volatility strategies are familiar in the investment world; portfolio managers have sought volatility reduction, explicitly or otherwise, for as long as there have been portfolio managers.
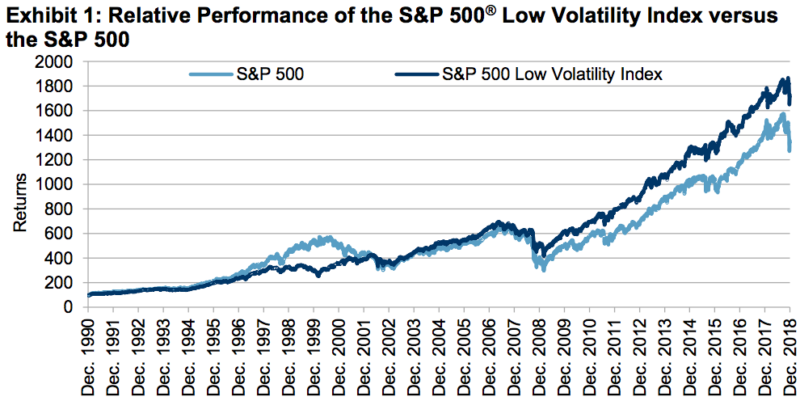
In the U.S., the S&P 500 Low Volatility Index was the first index vehicle to exploit this phenomenon systematically. Since 1991, the index has outperformed the S&P 500 (see Exhibit 1); more importantly, it has done so at a substantially lower level of volatility. Furthermore, the phenomenon is found in all markets segments and regions we have observed.
Lower risk… but higher returns?
There are different ways to construct a low volatility portfolio, giving portfolios different characteristics and results. One common assumption of these methodologies is that low volatility is a factor of return, in the same sense that small size or cheap valuation are regarded as factors of return. This is a counterintuitive—indeed, anomalous—assumption, since it seems to contradict what “everyone knows” about risk and return. Anyone who studies finance learns early on that risk and reward go hand in hand and that with higher expected returns come higher risks. Therefore, low volatility portfolios, which are by definition less risky than the market average, should underperform.
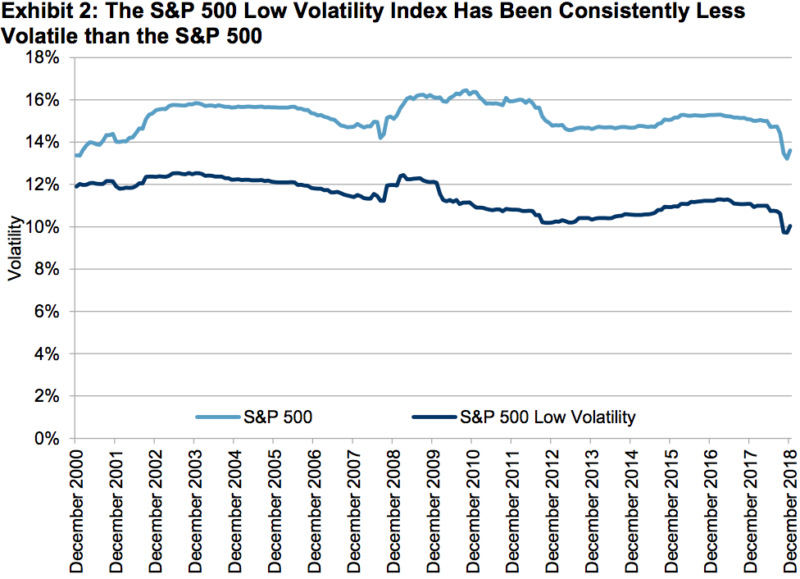
Against this logical theory we have only some inconvenient facts. The outperformance shown in Exhibit 1 was accompanied by volatility levels that, as Exhibit 2 shows, were consistently lower than those of the S&P 500. Over the 28-year period, the S&P 500 Low Volatility Index gained 10.7% compared to the S&P 500’s 9.8%, with a 23% lower standard deviation. Other examples abound. It’s no wonder that academics regard “the long-term outperformance of low-risk portfolios [as] perhaps the greatest anomaly in finance.”
Persistence
The methodology underlying the S&P 500 Low Volatility Index is almost painfully simple. Based on the standard deviation of the trailing 252 daily returns, we identify the 100 least volatile stocks in the S&P 500 and weight them inversely to their volatility. The index is rebalanced quarterly; no quadratic formulae need apply. We sometimes refer to this as a “rankings-based” approach to low volatility, since index inclusions are driven strictly by a stock’s volatility ranking compared to those of its peers.
This simple procedure does not require the construction of risk models or the artful use of complicated optimisation routines. What it does require, however, is the conviction that low volatility persists. Otherwise said, the methodology assumes that stocks that have been in the lowest quintile of volatility for the past year will continue to be of below-average volatility for at least the next quarter.
Is this assumption correct? The most obvious evidence has already been unveiled in Exhibit 2. When the S&P 500’s volatility rises (as in 2002 or 2008), the S&P 500 Low Volatility Index has also tended to be more volatile, but its volatility has been consistently lower than that of the S&P 500. In other words, the evidence that low volatility persists, at least in the short to medium term, is strong.
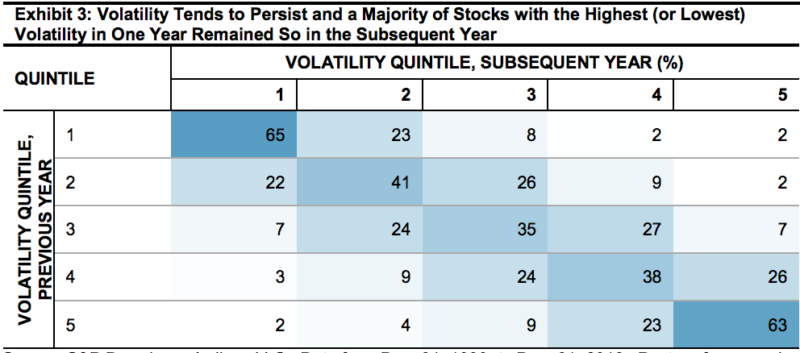
Exhibit 3 is another way to substantiate the rankings-based approach to accessing low volatility. The matrix shows the percentage of stocks in the S&P 500 that overlapped in specific volatility quintiles over two consecutive years. Sixty-five percent of the stocks in the least volatile quintile in year one continued in the least volatile quintile in year two. Nearly all of the stocks (88% = 65% + 23%) in the least volatile quintile had below average volatility in the following year. These data lend credence to the view that low volatility persists, at least in the short to medium term.
Performance patterns
It’s instructive to observe how low volatility performs in different market environments. In essence, low volatility strategies temper the performance of the market. This means that in rising markets, a low volatility index should lag its benchmark; in falling markets, low volatility should decline less than the benchmark. Exhibit 4 illustrates this succinctly. Monthly returns of the S&P 500 from 1991 through 2018 are plotted against the monthly return difference between the S&P 500 Low Volatility Index and the S&P 500. Performance differentials for the low volatility index exhibit a strong inverse relationship with the performance of the S&P 500.
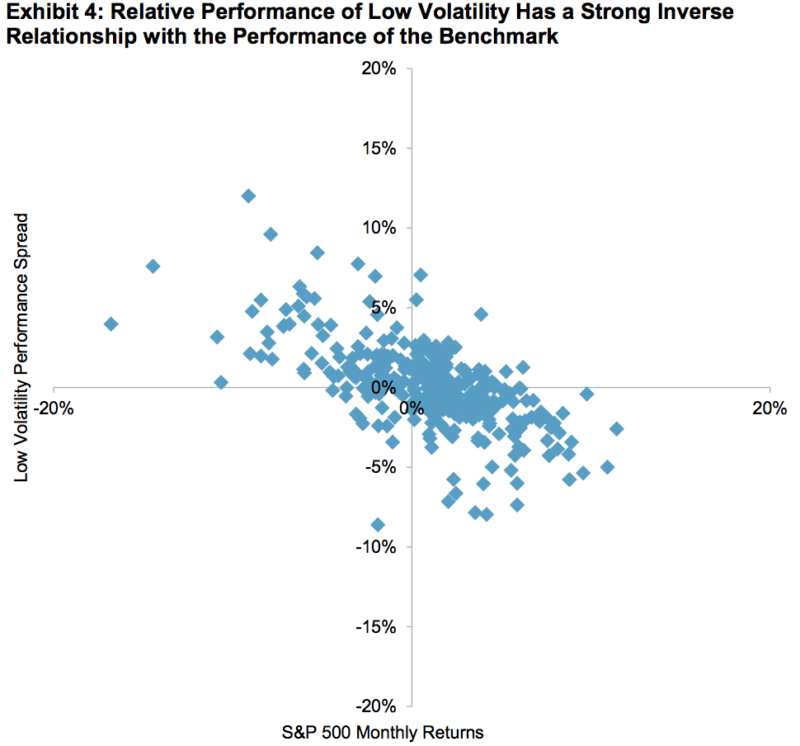
Exhibit 5 gathers the months from Exhibit 4 into four buckets. There were a total of 336 months in the period; the S&P 500 declined in 112 and rose in 224. We divided both the positive and negative months in half, which gives us an appreciation for the magnitude of market moves, as well as their direction.
For example, in the 56 months during which the S&P 500 declined the most, the S&P 500 Low Volatility Index outperformed by an average of 2.85%. Moreover, its hit rate was 88% — meaning that it outperformed the S&P 500 in 49 months, 88% of the total. Moving along the chart in Exhibit 5, the spread between the S&P 500 Low Volatility Index and the S&P 500 diminishes, and the hit rates decline as well. In the 112 best months, the S&P 500 Low Volatility Index underperformed 82% of the time, by an average of -1.70%. Results are analogous in the smaller negative and smaller positive months.
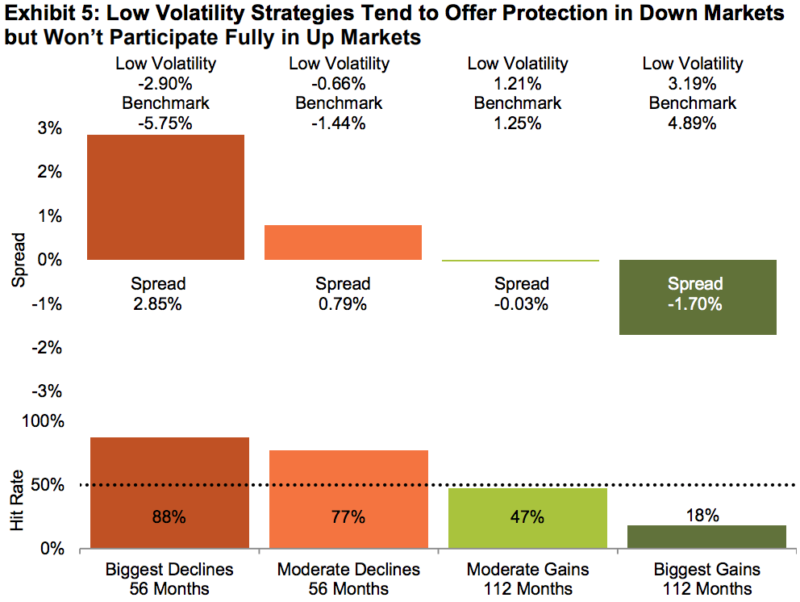
We can therefore conclude that the low volatility strategy attenuates the market’s return, in both directions. The S&P 500 Low Volatility Index tended to rise less than the market when the market was up, and tended to decline less than the market when the market was down—and that’s why its overall volatility was lower than that of the S&P 500. Low volatility strategies allow for market participation during good times while also providing protection in bad times.
Universality
If the low volatility story ended there, it would be an interesting strategy for U.S. portfolio managers, but not much more. However, there is more to the story; applying the methodology originally developed for the S&P 500 produces similar results in a range of other markets. The critical elements of this methodology are simple:
– Measure volatility with daily returns over a one-year period;
– Select approximately one-fifth of the stocks in the benchmark index as constituents of the low volatility index;
– Weight the constituents inverse to their volatility; and
– Rebalance quarterly.
As in the U.S., all regional low volatility indices make the critical assumption that low volatility persists.
Exhibit 6 demonstrates that for mid- and small-cap U.S. stocks, as well as for a range of international markets, this methodology has produced substantial reductions in volatility relative to the applicable benchmark index. Without exception, it also generated superior returns.
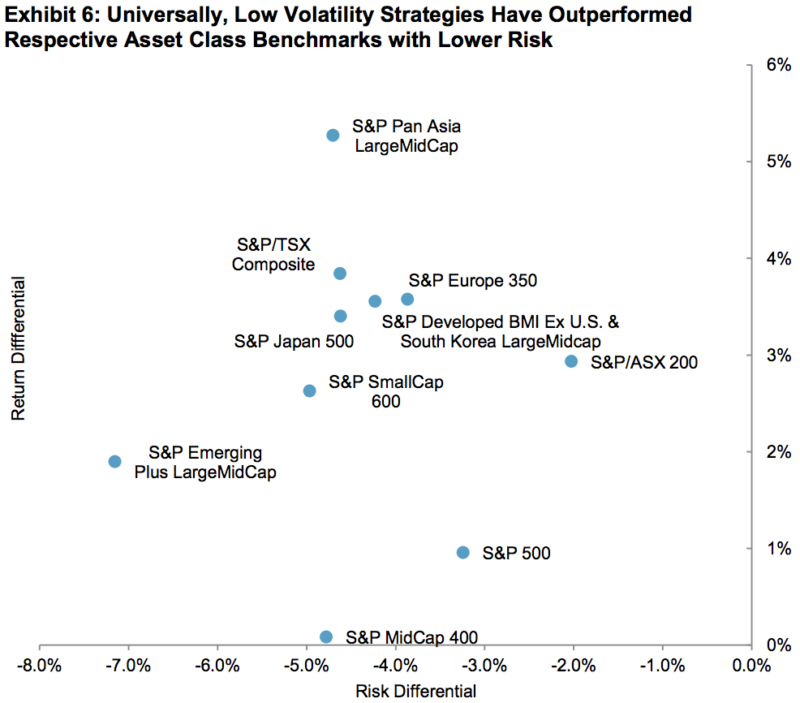
It’s particularly important, when comparing low volatility strategies from different regions, to be aware of the differential impact of each market environment. For example, Exhibit 6 shows us that low volatility outperformed in Pan Asia by a much greater amount than in the U.S., but that could be because the Asian markets did not perform as well during our test period as the U.S. market (recall from Exhibit 5 that low volatility indices tend to outperform in weak markets and underperform in strong ones).
To improve our understanding of low volatility’s performance in the Pan Asia region, we constructed Exhibit 7, which shows the impact of the market environment on low volatility. Comparing Exhibits 5 and 7 shows that in Pan Asia, the low volatility strategy worked almost identically to its S&P 500-based counterpart. As market conditions improved, the low volatility strategy tended to underperform. In weak markets, the low volatility strategy tended to outperform. The same pattern can be observed in other markets.
In summary, wherever we’ve looked, simple, rankings-based low volatility strategies have attenuated the volatility of their benchmark indices, typically while recording higher levels of total return. Whatever one might say about the low volatility anomaly, it is clearly not unique to large-capitalisation U.S. stocks.
Partitioning low volatility’s outperformance
An investment strategy’s success can be measured by both frequency and magnitude: how often it outperforms, and by how much. In data for the U.S., for example, the S&P 500 Low Volatility Index outperformed the S&P 500 in 49% of the months in our data set. When it outperformed, the average monthly outperformance was 1.98%, while the average underperformance in months when low volatility lagged the S&P 500 was 1.83%. In a performance sense, in other words, low volatility lost slightly more often than it won, but it won by a larger spread when it outperformed than it lost when it underperformed.
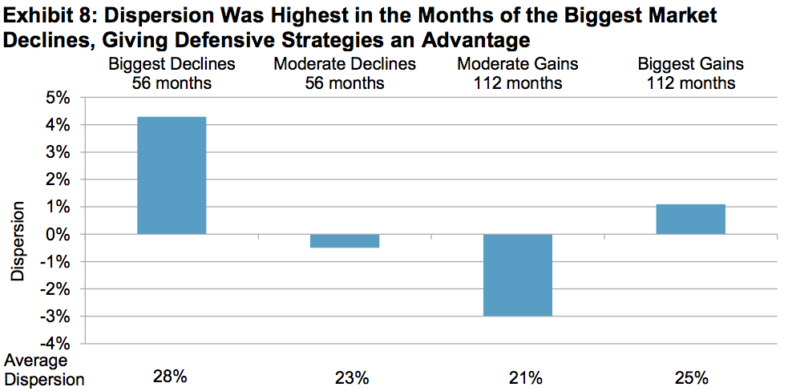
The concept of dispersion can illuminate this asymmetry. Dispersion measures the degree to which stock returns in a given market differ from one another. The higher the dispersion is, the greater will be the difference between the returns of a capitalisation-weighted index and the returns of a factor index such as low volatility. The periods in which low volatility has tended to outperform have been periods of above-average dispersion. Similarly, the periods in which low volatility has underperformed have been periods of below-average dispersion.
This effect is not coincidental. As we’ve seen, low volatility (and other defensive indices) tend to outperform in weak stock markets. Weak stock markets tend to occur in times of relatively high volatility. And high volatility is typically associated with high dispersion.
From 1991 through 2018, average monthly dispersion for the S&P 500 was 23.6%. Exhibit 8 shows that in the months of the S&P 500’s worst performance, dispersion was 4% greater than average. Put simply, the months when low volatility strategies were most likely to outperform tended to be months when the payoff for being right was above average; the months when low volatility was likely to underperform tended to be months when the penalty for being wrong was below average.
It is tautological that any defensive index, low volatility included, will mitigate the market’s moves in both directions. Capture ratios (computed as the ratio of low volatility performance to benchmark performance) should always be less than 1.00. The advantage of low volatility is that the upside capture ratio is characteristically greater than the downside capture, as illustrated in Exhibit 9.
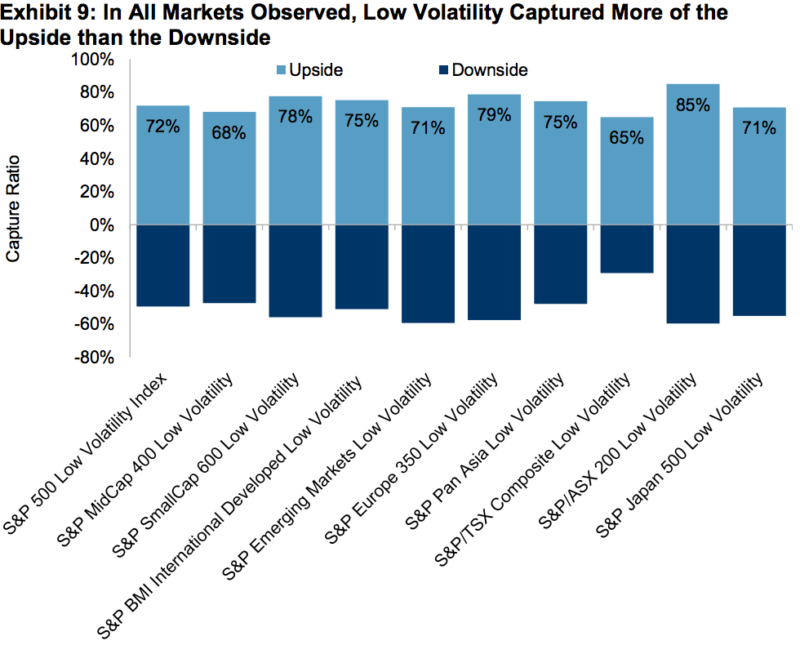
This is not a lucky coincidence—it follows directly from the way in which dispersion interacts with the market’s direction. When the market is down, low volatility tends to outperform, and dispersion tends to be high. The gap between the performance of low volatility and the benchmark is therefore relatively large, leading to low capture ratios. When the market is up, low volatility tends to underperform, but dispersion tends to be low. The gap between the performance of low volatility and the benchmark is therefore relatively small, producing higher capture ratios.
Rationalising the low volatility anomaly
There are a number of (non-mutually exclusive) explanations for the existence of a low volatility effect or anomaly. We highlight two, both of which explain why market participants might be inclined to overpay for high volatility stocks.
One explanation is leverage aversion. The Capital Asset Pricing Model (CAPM) argues that a stock’s return should be proportionate to its systematic risk, or beta. Early empirical tests found that this formulation worked well for stocks with betas below 1.00, but not for higher beta stocks. One explanation for this is that the CAPM assumes that all investors should own the market portfolio; if they want more risk than the market offers, they should own the market portfolio with leverage. In practice, transaction costs and regulatory restraints inhibit the use of leverage. An investor targeting a beta of 1.20 is unlikely to hold the S&P 500 with 20% leverage—instead he’ll buy a portfolio of stocks with a beta averaging 1.20. This creates excess demand for high beta, high volatility stocks, elevating their prices above intrinsic value. A strategy that systematically avoids such stocks is therefore likely to benefit.
A second explanation comes from the realm of behavioural finance, specifically from the cognitive bias that behavioural economists call the “preference for lotteries.” Their argument is that no rational person would ever buy a lottery ticket, since the expected return of such a purchase is negative. But we know that billions of lottery tickets are sold all over the world every day. Why do so many people behave in a way that classical economics regards as completely irrational? The behavioural argument is that some people are willing to risk a known amount of money in exchange for the possibility, however slim, of a gigantic payoff.
If this happens in a game of chance, how does it apply to financial markets? What’s the analogy to a lottery ticket in the stock market? The stock market’s lottery tickets are the stocks of highly volatile companies. Ultimately, they may not amount to much, but one of them could be the next Apple. Some investors are willing to pay for the chance of an improbable— but very large—reward.
This tendency, which also amounts to buying volatility for volatility’s sake, drives the price of lottery-like stocks above their fair value. This means that a portfolio that systematically excludes the most-volatile stocks— exactly what rankings-based low volatility indices do—is more likely to outperform over time, globally.
Conclusion
The low volatility anomaly is an observable phenomenon across market segments and regions. Low volatility indices have outperformed their capitalisation-weighted benchmarks over time with lower risk. Even more remarkably, without exception, low volatility indices exhibit a distinct pattern of returns when compared to their benchmarks. They all attenuate the performance of the broader market, losing less when markets decline and gaining less when markets rise. Because of this dynamic, low volatility indices are poised to take advantage of an important market characteristic; they outperform in periods of relatively high dispersion. Otherwise said, low volatility strategies tend to be right when the payoff for being right is most advantageous.
This article was originally published by S&P Dow Jones Indices and is republished here with their kind permission.
More from Craig Lazzara on The Evidence-Based Investor:
Are passive managers really kings of Wall Street?
SPIVA: What it is and what it tells us — Craig Lazzara (Part 1)
Poor fund performance Is a global problem — Craig Lazzara (Part 2)


