
By LARRY SWEDROE
Asset pricing models are important because they help us understand which factors explain the variation of returns across diversified portfolios. However, models are not like cameras that provide a perfect picture of the world. If models were perfectly correct, they would be laws, like we have in physics. Instead, models are engines that advance our understanding of how markets work and prices are set. The first formal model was the CAPM (capital asset pricing model), a single factor (market beta) model that was able to explain about two-thirds of the variation of returns among portfolios.
Since the development of the CAPM, academic research has attempted to find models that increase the explanatory power of the cross-section of stock returns. We moved from the single-factor CAPM (market beta), to the three-factor Fama-French model (adding size and value), to the Carhart four-factor model (adding momentum), to Lu Zhang’s q-factor model (beta, size, investment, profitability), to the Fama-French five-factor (adding value to the q-factor model) and six-factor models (adding back value and momentum to the q-factor model). There have also been versions that use different metrics for profitability and value, and Stambaugh and Yuan’s mispricing (anomaly)-based model. Regardless of the model used, the empirical evidence demonstrates that stocks with high research and development (R&D) expenses have delivered a premium.
For example, using a measure of R&D intensity (R&D relative to market value), Woon Sau Leung, Khelifa Mazouz and Kevin Evans, authors of the 2020 study The R&D Anomaly: Risk or Mispricing?, found a statistically economically significant monotonic increase in average returns from 0.67 percent for Portfolio 1 (lowest decile) to 2.23 percent for Portfolio 10 (highest decile). They also found that the premium persisted after adjusting for size, value and momentum effects. In addition, the zero-cost spread portfolio (Portfolio 10-1) yielded a Carhart four-factor alpha of 1.35 percent and a Fama French five-factor alpha of 1.52 percent per month, both significant at the 1 percent level—the R&D anomaly cannot be explained by existing pricing, including the relatively recent investment and profitability factors.
Leung, Mazouz and Evans also found: “The R&D premium correlates positively with innovations to the aggregate dividend yield, and negatively with shocks to the default spread and risk-free rate, demonstrating the sensitivity of R&D stocks to variables that predict future business conditions. Moreover, the loadings on these three state variable innovations are significantly priced in the cross section of R&D stock returns and even drive out size and book-to-market equity factors. These results demonstrate that the R&D premium represents significant and incremental reward for bearing intertemporal risk.” We can conclude that the empirical evidence demonstrates that the R&D premium remains an anomaly to all models.
Their findings of risk-based explanations for the R&D effect are consistent with those of Jangwook Lee and Jiyoon Lee, authors of the March 2020 study Mispricing or Risk Premium? An Explanation of the R&D-to-Market Anomaly. They are also consistent with the risk-based theoretical prediction of Jonathan Berk, Richard Green and Vasant Naik, authors of the 2004 study Valuation and Return Dynamics of New Ventures, who explained: “Firms learn about the potential profitability of the project throughout its life, but that technical uncertainty about the R&D effort is only resolved through additional investment. Consequently, the risks associated with the ultimate cash flows have a systematic component even while the purely technical risks are idiosyncratic.”
New evidence
Kewei Hou, Po-Hsuan Hsu, Shiheng Wang, Akiko Watanabe and Yan Xu contribute to the literature with their study Corporate R&D and Stock Returns: International Evidence, published in the June 2022 issue of the Journal of Financial and Quantitative Analysis, in which they examined the cross-sectional return predictability of R&D in international equity markets. Their goal was to extend our understanding of the role of intangible assets and technological innovation in asset pricing. Their data sample covered 21 developed and emerging market countries with stock returns over the period July 1981-June 2018. Their primary proxy for R&D intensity was a firm’s annual R&D expenditure divided by its market capitalisation. Following is a summary of their findings:
- In global sorts, the top quintile portfolio outperformed the bottom one by 1.024 percent (0.537 percent) per month in equal-weighted (value-weighted) returns. The finding that the equal-weighted spread is more significant than the value-weighted suggests that substantially higher subsequent returns for more intensive R&D investments are more pronounced among smaller firms.
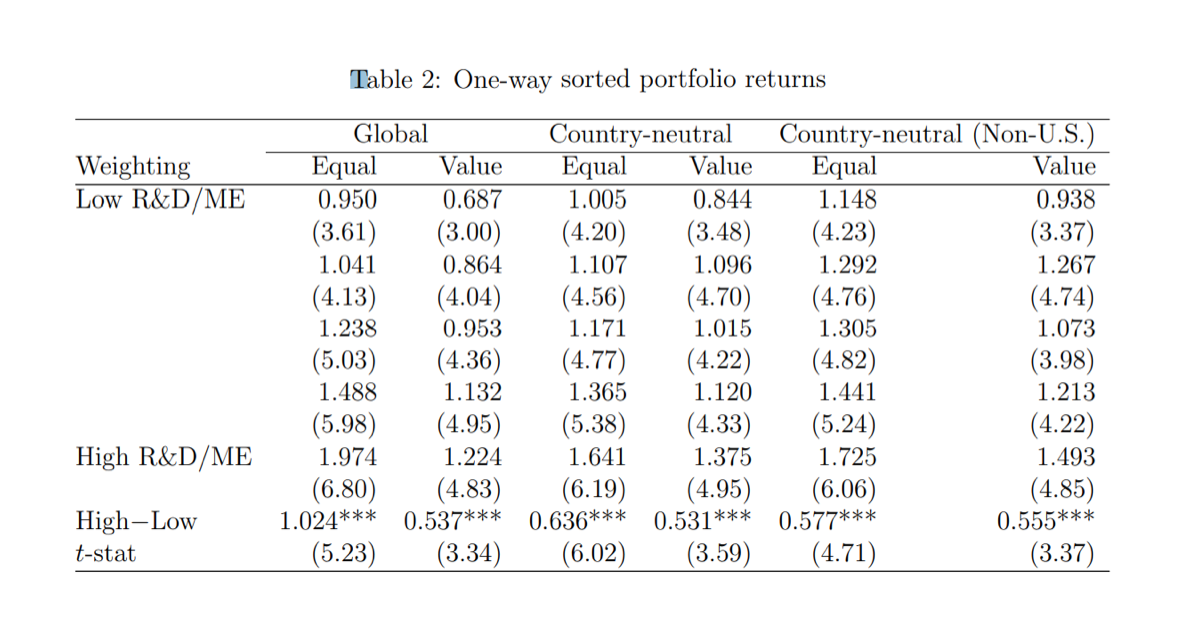
- Using country-neutral sorts, the top quintile portfolio outperformed the bottom one by 0.636 percent (0.531 percent) per month in equal-weighted (value-weighted) returns. Similar results were found when U.S. firms were excluded.
- The R&D effect is not concentrated in smaller or larger firms and cannot be explained by common equity factors used in asset pricing models (including beta, size, value, momentum).
- The findings were robust to various definitions of R&D intensity, such as total assets and book equity, as well as controlling for industry.
- The R&D effect was significantly related to dispersions in growth option proxies but not to limits to arbitrage or sentiments proxies—the effect is explained by risk, not mispricing.
- R&D-intensive firms were associated with higher future operating performance, return volatility and default likelihood—the R&D effect is closely related to risk.
Their findings led Hou, Hsu, Wang, Watanabe and Xu to conclude: “In international equity markets, firms with higher R&D intensity subsequently experience higher stock returns.”
Investor takeaways
Supported by the findings of a significant positive relationship between R&D expenditures and future stock returns and the risk-based explanations for the R&D effect, the empirical research suggests a fundamentally important role of intellectual capital, specifically R&D, in asset pricing—the higher returns to high R&D stocks represent compensation for heightened systematic risk not captured in standard asset pricing models.
Unfortunately, the ability to interpret financial statements has been complicated by the dramatic shift from tangible investments (such as plant and equipment) to intangible investments (such as R&D, advertising and expenses related to human capital). The increasing role of intangibles is highlighted by the fact that R&D expenditures increased from 1 percent of company expenditures in 1975 to 7.5 percent in 2018 and that in 2015, services’ share of GDP stood at 74 percent in high-income countries and just under 69 percent globally.
Given the shift in expenditures, it should not be a surprise that researchers, including the authors of the 2020 studies Explaining the Recent Failure of Value Investing, Intangible Capital and the Value Factor: Has Your Value Definition Just Expired? and Equity Investing in the Age of Intangibles, and the 2021 study Value of Internally Generated Intangible Capital, have focused attention on the impact on equity valuations and returns resulting from the change in the relative importance of intangible assets compared to physical assets.
The authors of these studies found that the increasing importance of intangibles, at least for industries with high concentrations of them, is playing an important role in the cross-section of returns. Thus, the role of intangibles should be addressed in portfolio construction for the reason that not accounting for them affects not just value metrics but other measures (e.g., profitability) that often scale by book value or total assets, both of which are affected by intangibles. One solution recommended and used by some investment management firms is to capitalise the investments that appear on the income statement and amortise them over their useful lives. This means treating an intangible investment the same as a tangible investment. However, that raises questions such as: Which income statement items are appropriately considered investments? And what is a proper useful life for those assets?
In terms of the intensity of intangible assets, there is significant variance across industries. This is important for investors who rely predominately on multiples for valuation and for portfolio construction. Adjusting for intangibles can result in a large operating profit margin expansion for companies that are intangible intensive and insignificant changes for ones that are tangible intensive. This suggests caution in comparing earnings or multiples across industries and over time.
Academics and fund managers have been trying to address the issues related to intangibles not being on the balance sheet through various methods. One method is to use alternatives to price-to-book (P/B) as the value metric, such as price-to-earnings (P/E), price-to-cash flow (P/CF) and enterprise value-to-earnings before interest, taxes, depreciation and amortisation (EV/EBITDA). Many fund families (such as Alpha Architect, AQR, BlackRock, Bridgeway and Research Affiliates) use multiple value metrics (such as P/E, P/CF, P/S and EBITDA/EV), some of which indirectly provide exposure to the profitability factor. Another alternative is to add other factors into the definition of the eligible universe. For example, since 2013 Dimensional has included a sort for profitability in their value funds. A third alternative is to add back to book value an estimate of the value of intangible R&D and organisational expenses. A fourth way to address the issue is to apply what some call “contextual” stock selection, using different metrics or different weightings of those metrics depending on the intangible intensity. For example, if book value is not well specified for industries with high intangibles, it may be less effective in those industries than in industries with low intangibles.
At any rate, at least for most practitioners, the exclusive use of the traditional high-minus-low (HML) factor to build a value portfolio is no longer standard practice. In fact, none of the fund families my firm, Buckingham Strategic Wealth, uses in its portfolios exclusively use HML to construct its value funds. Stay tuned, as we are likely to see more research on this important subject.
For informational and educational purposes only and should not be construed as specific investment, accounting, legal, or tax advice. Certain information is based upon third party data which is deemed to be reliable, but its accuracy and completeness cannot be guaranteed. Third party information may become outdated or otherwise superseded without notice. By clicking on any of the links above, you acknowledge that they are solely for your convenience, and do not necessarily imply any affiliations, sponsorships, endorsements or representations whatsoever by us regarding third-party Web sites. We are not responsible for the content, availability or privacy policies of these sites, and shall not be responsible or liable for any information, opinions, advice, products or services available on or through them. The opinions expressed by featured authors are their own and may not accurately reflect those of Buckingham Strategic Wealth® or Buckingham Strategic Partners® , collectively Buckingham Wealth Partners. Neither the Securities and Exchange Commission (SEC), nor any other federal or state agency have approved, determined the accuracy, or confirmed the adequacy of this article. LSR-22-316
LARRY SWEDROE is Chief Research Officer at Buckingham Strategic Wealth and the author of numerous books on investing.
ALSO BY LARRY SWEDROE
Factor momentum and stock momentum
How wealth, age and gender affect investment decisions
What does a change in ESG rating tell us about future returns?
The risks of highly concentrated equity portfolios
Gaming ESG fund performance to attract assets
WOULD YOU LIKE TO PARTNER WITH US?
Content such as this would not be possible without the support of our strategic partners, to whom we are very grateful.
TEBI’s principal partners in the UK are S&P Dow Jones Indices and Sparrows Capital. We also have a strategic partner in Ireland — Biograph Wealth Advisors, a financial planning firm in Dublin.
We are currently seeking partnerships in North America and Australasia with firms that share our evidence-based and client-focused philosophy. If you’re interested in finding out more, do get in touch.
© The Evidence-Based Investor MMXXII


