By LARRY SWEDROE
“Those who cannot remember the past are condemned to repeat it.”
– George Santayana
From 2008 through 2019, the S&P 500 Index provided a total return of 184 percent versus just 25 percent for the MSCI EAFE Index, and an even lower 20 percent for the MSCI Emerging Markets Index. That performance gap has caused many to question the wisdom of global diversification. However, the world looked very different to investors as we entered this period.
Over the five-year period 2003 through 2007, while the S&P 500 Index provided a healthy total return of 83 percent, the MSCI EAFE Index more than doubled that, returning 171 percent. And emerging market stocks did even better. The MSCI Emerging Markets Index provided a total return of 391 percent. Even more impressive was the 503 percent total return of the Fama-French Emerging Market Small Stock Index and the 511 percent return of the Fama-French Emerging Markets Value Index. (Fama-French data is from Ken French’s website.)
Returns were fairly similar during the 2000 through 2002 bear market. But over the decade of the 1990s, U.S. stocks far outperformed, with the S&P 500 Index providing a total return of 433 percent versus 103 percent and 186 percent for the EAFE and Emerging Markets Indexes, respectively. However, over the prior two decades, while the EAFE Index was providing a total return of 1,934 percent, the S&P 500 provided a total return of 790 percent.
Because it is difficult to determine when one region will outperform the other, investors are best off owning globally diversified portfolios that reflect how capital is allocated. This means a good starting point should be the global market capitalisation. At the end of 2018, it was approximately 54 percent U.S. and 46 percent international.
Another important point to note is that the last decade of outperformance by U.S. stocks has resulted in their valuations being dramatically higher than those of international stocks. For example, at year-end 2019, the CAPE 10 earnings yield (E/P, the inverse of the more commonly cited P/E, or price-to-earnings ratio) for the S&P 500 Index was 3.2. And that’s as good a predictor of future real returns as we have. The CAPE E/P for the EAFE Index was 2 percent higher at 5.2 percent, and it was 1.5 higher still at 6.7 percent for the Emerging Markets Index. Investors who become subject to the behavioural bias known as recency end up buying after periods of good performance (when valuations are high and expected returns are low) and selling after periods of poor performance (when valuations are low and expected returns are high). That’s not exactly a prescription for investment success.
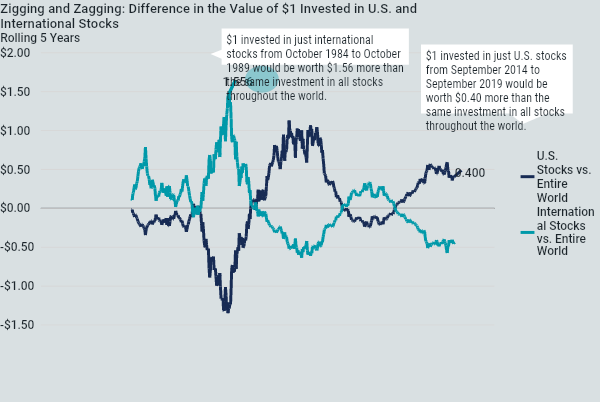
Thanks to the research team at Avantis for putting together the chart below which separates U.S. and international stocks and compares their performance to that of all stocks throughout the world.
LARRY SWEDROE is Chief Research Officer at Buckingham Strategic Wealth and the author of 17 books on investing, including Think, Act, and Invest Like Warren Buffett.
Want to read more of his work? Here are his most recent articles published on TEBI:
Value investors should follow their heads, not their stomachs
Why the latest attack on passive investing is nonsense
Do active funds perform better in less efficient markets?
Why superstar investors are a dying breed
The investment impact of an ageing population