
By CRAIG LAZZARA
Traditional investors think of portfolios (whether active or indexed) as collections of stocks. We can equally well think of portfolios as collections of factors — defining factor in the academic sense, as an attribute with which excess returns are thought to be associated. If we’re correct in assessing these attributes, it should be possible to explain portfolio performance by reference, not to the stocks that the portfolio owns, but rather to the factors that it embodies.
One way to illustrate this is with reference to factor indices. It’s obvious, for example, that a well-constructed value index is tilted toward cheap stocks (i.e. toward the value factor), but it’s equally true, if less obvious, that a value index might have other tilts as well — for example, toward smaller companies, or higher yields, or lower quality. If this is true, then the performance of factor indices might be explained, in part, by reference to multiple factor exposures.
We’ve noted before that one of the most salient features of 2022 factor index performance was the reversal of several multi-year trends. Equal weight beat cap weight, Low Volatility beat High Beta, and most strikingly, Value outperformed Growth. The Value-Growth differential was so large, in fact, that it explained nearly 80% of the variance in returns across other factor indices, as Exhibit 1 illustrates.
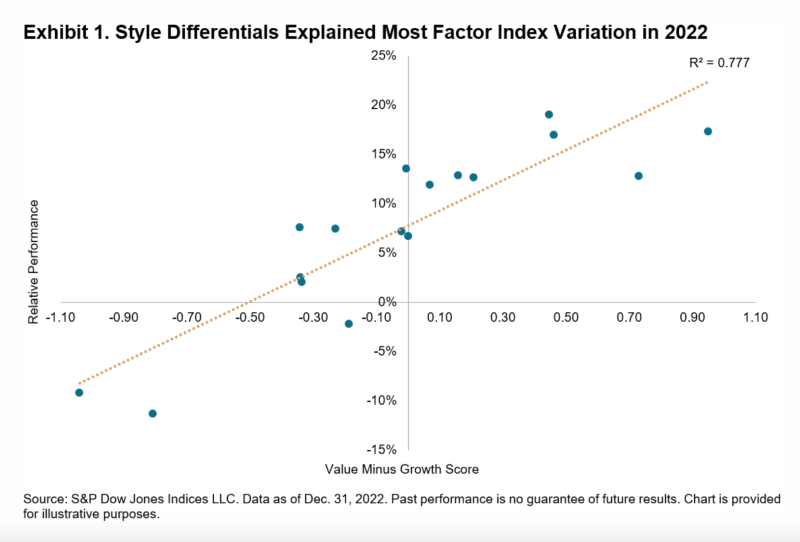
Exhibit 1, though interesting, relies on data from only 17 factor indices. Some stocks will be represented in several of these indices, while others might not be included in any. What happens if we ask how factor exposure affected performance at the individual stock level?
We can approach this question by ordering the constituents of the S&P 500 by the factors of interest, grouping into quintiles, and then measuring returns by quintile. The difference between top and bottom quintiles (i.e., between the average return of the stocks most exposed to the factor and the average return of those least exposed) gives us a convenient way to summarise each factor’s influence. Exhibit 2 shows results for 2022.
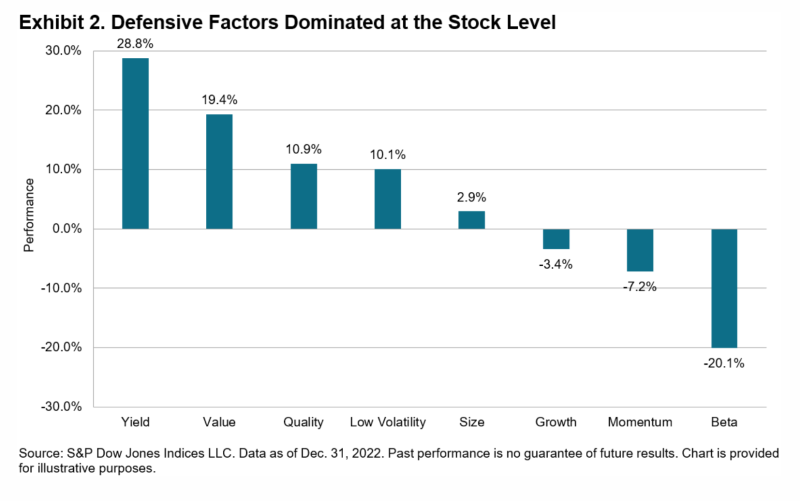
Yield was the year’s strongest factor by far, as the market’s highest dividend payers beat non-payers by nearly 29%. Value was in second place, with defensive stalwarts Quality and Low Volatility filling out the top four places. The difference between the performances of Value and Growth is quite consistent with the observations we made in Exhibit 1.
Other things equal, as granularity increases, the importance of factors declines. An individual stock will be more heavily influenced by idiosyncratic factors than will be a diversified portfolio. Even at the stock level, however, understanding factor exposures can produce useful performance insights.
CRAIG LAZZARA is Managing Director and Global Head of Index Investment Strategy at S&P Dow Jones Indices.
This article was first published on the Indexology blog.
MORE FROM S&P DJI
For more valuable insights from S&P Dow Jones Indices, you might like to read these other recent articles:
Is this market ripe for stockpickers?
Will peak passive help or hinder active managers?
UK investors pay a price for ignoring America
WANT TO LEARN MORE ABOUT EVIDENCE-BASED INVESTING?
When it comes to planning your financial future, you need a strategy that’s based on solid foundations.
In their new book, How to Fund the Life You Want, Robin Powell and Jonathan Hollow explain how evidence-based investing works, and the practical steps you need to take to implement an evidence-based investment strategy.
It’s published by Bloomsbury and is primarily intended for a UK audience.
You can buy the book on Amazon, on Bookshop.org, and in all good bookshops. There are eBook and audio book versions as well.
© The Evidence-Based Investor MMXXIII


