
By LARRY SWEDROE
Every year the markets provide us with lessons on the prudent investment strategy. They frequently offer remedial courses, covering lessons they taught in previous years. That’s why one of my favourite sayings is that there’s nothing new in investing, only investment history you don’t know. This is the first in a two-part series that will cover ten lessons. As you may note, many of them are repeats from prior years. Unfortunately, too many investors fail to learn them — they keep making the same errors.
Lesson 1: Valuations cannot be used to time markets.
We entered 2021 with U.S. equity valuations at very high levels. In particular, the popular metric known as the Shiller CAPE 10 was about 34, well above the historical average of about 17. Basically, we had been above that just one other time, in the late 1990s, and that was followed by a severe bear market. That led many forecasters to predict poor returns. For example, “legendary” investor Jeremy Grantham, chief investment officer of GMO, predicted that 2021 would see a stock market crash: “When the decline comes, it will perhaps be bigger and better than anything previously in U.S. history.” Investors who listened to that advice and sold equities missed out on the market’s strong performance — Vanguard’s S&P 500 ETF (VOO) returned 28.8 percent.
In his 2012 study, Cliff Asness showed why one should not use the CAPE 10 to try to time markets. He found that when it was above 25.1, the real return over the following 10 years averaged just 0.5 percent—virtually the same as the long-term real return on the risk-free benchmark, one-month Treasury bills, and 6.3 percentage points below the U.S. market’s long-term real return. This concerned many investors, possibly leading them to reduce, or even eliminate, their equity holdings. However, there was still a wide dispersion of outcomes: The best 10-year forward real return was 6.3 percent, just half a percentage point below the historical average, while the worst was -6.1 percent.
In addition, what many investors may not have been aware of is that when using traditional price-to-earnings (P/E) ratios, history shows there is virtually no correlation between the market’s P/E and how the market performs over the subsequent year. The following is a good reminder of that.
On January 1, 1997, the CAPE 10 was at 28.3. The highly regarded (at least at the time) Chairman of the Board of the Federal Reserve, Alan Greenspan, gave a talk in which he famously declared the U.S. stock market to be “irrationally exuberant.” That speech, given in Tokyo, caused the Japanese market to drop about 3 percent, and markets around the globe followed. Over the three years 1997 through 1999, the S&P 500 Index returned 33.4 percent, 28.6 percent and 21.0 percent, respectively, producing a compound return of 27.6 percent.
While higher valuations do forecast lower future expected returns, that doesn’t mean you can use that information to time markets. And you should not try to do so, as the evidence shows such efforts are likely to fail. This doesn’t mean, however, that the information has no value. You should use valuations to provide estimates of returns so you can determine how much equity risk you need to take in your portfolio to have a good chance of achieving your financial goals. However, expected returns should only be treated as the mean of a potentially wide dispersion of outcomes. Your plan should address any of these outcomes, good or bad.
Lesson 2: Active management is a loser’s game.
Despite an overwhelming amount of academic research demonstrating that passive investing is more likely to allow you to achieve your most important financial goals, the majority of individual investor assets are still held in active funds. Last year was another in which the large majority of active funds underperformed the markets. VOO (Vanguard’s 500 Index ETF) outperformed 76 percent of active funds in its Morningstar category, returning 28.8 percent. Yet, like all years, 2021 provided a great opportunity for active managers to generate alpha through the large dispersion in returns between 2021’s best-performing and worst-performing stocks. For example, 10 stocks within the S&P 500 Index were up at least 118 percent. The following table shows the 10 best returners:
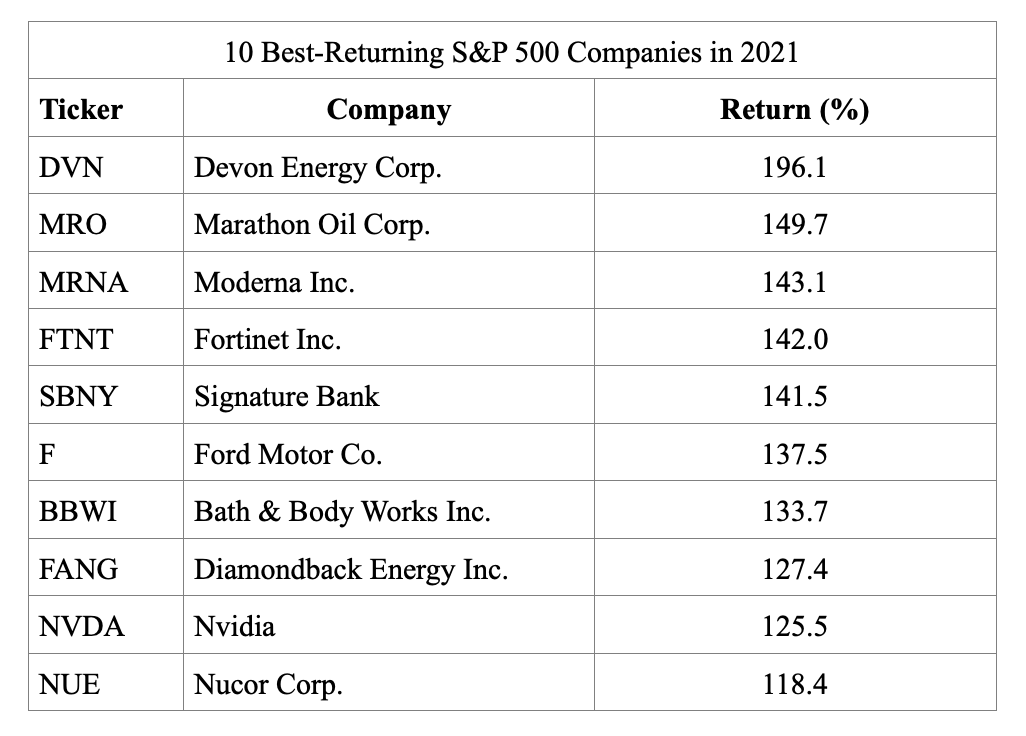
To outperform, all an active manager had to do was overweight those big winners, which outperformed the index by at least 89 percentage points. On the other hand, ten stocks lost at least 22 percent, with the worst performer losing almost 41 percent.
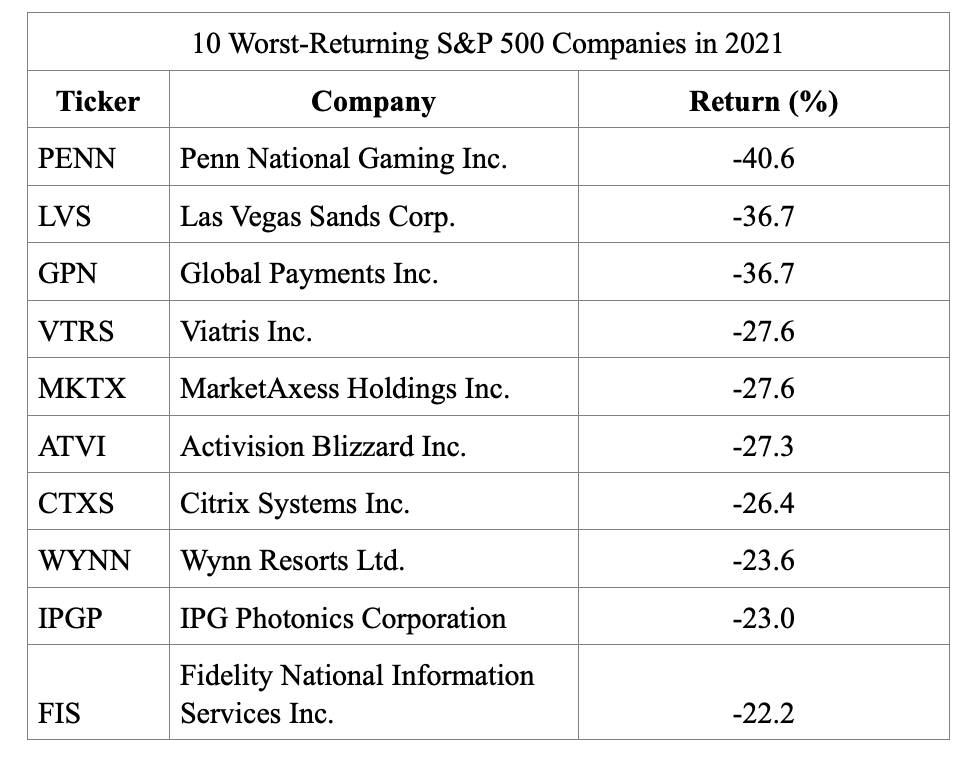
To outperform, all an active manager had to do was underweight, let alone avoid, these dogs, each of which underperformed VOO by at least 50 percentage points. This wide dispersion of returns is typical. Yet, despite the opportunity, year after year in aggregate, active managers persistently fail to outperform.
In case you thought active managers in small-cap stocks did better, the iShares Core S&P Small-Cap ETF (lJR) outperformed 66 percent of active small-cap managers, returning 26.6 percent. The results make it clear that active management is a strategy that can be said to be “fraught with opportunity.” Year after year active managers come up with excuses to explain why they failed and then argue that the next year will be different. Of course, it never is.
Lesson 3: Don’t make the mistake of recency; last year’s winners are just as likely to be this year’s dogs.
The historical evidence demonstrates that individual investors are performance chasers—they buy yesterday’s winners (after the great performance) and sell yesterday’s losers (after the loss has already been incurred). This causes investors to buy high and sell low—not exactly a recipe for investment success. As I wrote in my book “The Quest for Alpha,” this behavior explains the findings from studies that show investors can actually underperform the very mutual funds in which they invest. For example, as cited in “A Quest for Alpha,” a 2005 study published by Morningstar FundInvestor found that in all 17 fund categories they examined, the returns earned by investors were below the returns of the funds themselves. Unfortunately, a good (poor) return in one year doesn’t predict a good (poor) return the next year. In fact, great returns lower future expected returns, and below-average returns raise future expected returns.
The “poster child” for the recency mistake could be Cathie Wood’s ARK Innovation Fund (ARKK). The fund’s inception was November 2014. While the fund performed poorly in its first two full years (Morningstar percentile ranking of 75 in 2015 and 98 in 2016), at that point the fund had only about $200 million of assets under management (AUM). The fund performed well in 2017, earning a 1st percentile ranking (returning 87.3 percent), and again in 2018, earning a 17th percentile ranking (even though it gained just 3.5 percent). In 2019 ARKK’s performance reverted, as it underperformed, earning a 57th percentile ranking even though it returned 25.6 percent. From inception through 2019, ARKK earned 20.6 percent per annum versus 11.8 percent for VOO. That type of performance attracts investors who believe the past performance of active managers is a predictor of future performance, and AUM grew to about $1.9 billion.
ARKK turned in a spectacular performance in 2020, earning a 1st percentile ranking, returning 153 percent. AUM grew to about $21.5 billion. And cash continued to flood in, as by February 12 the fund was up about 25 percent for the year. AUM reached a peak of about $28 billion that month. Unfortunately for investors, the fund lost 23.6 percent for the full year, earning it a 100th percentile ranking. And investors who continued to pour money into the fund in early 2021 did much worse, as the fund lost about 37 percent from its peak on February 12. AUM had fallen to about $16 billion at year’s end, falling by far more than the losses alone could explain as some investors abandoned ship. In other words, the strongest performance came when assets were just a small fraction of what they were when the fund had its worst performance. It is often the case that the mistake of recency leads to investor returns that are below the reported returns of the funds in which they invest. (See disclosure)
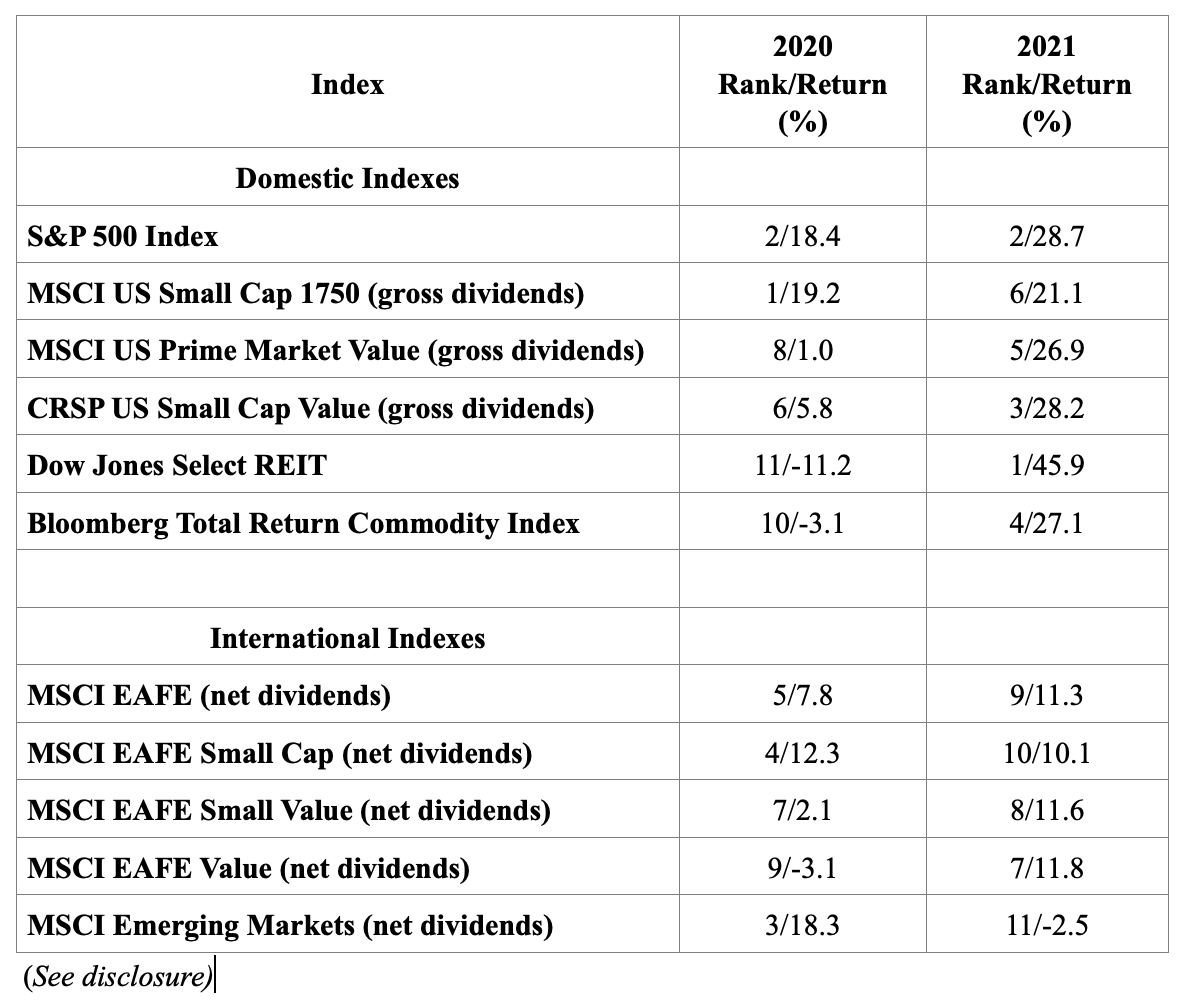
The following table compares the returns of various asset classes in 2020 and 2021. As you can see, sometimes the winners and losers repeated, but other times they changed places. For example, the worst performer in 2020, U.S. REITs, was by far the best performer in 2021, returning 45.9 percent, outperforming the second-place finisher (S&P 500) by 17.2 percentage points. The best performer in 2020, U.S. small caps, fell from first to sixth place; the third best performer, emerging markets, fell all the way to 11th place; and the second worst performer in 2020, commodities, improved from tenth to fourth place.
Lesson 4: Gold is not an inflation hedge over your investment horizon.
Gold ended 2020 at about $1,894. With many investors concerned about the inflation risks caused by the combination of very stimulative fiscal policy (record budget deficits) and very loose monetary policy (significantly negative real interest rates), they may have looked to gold as a way to hedge that risk. Another factor that may have influenced investor interest in gold was that it had performed extremely well recently (creating recency bias)—in September 2018 it was trading at about $1,300. While the inflation risk was realized, with the CPI increasing about 7 percent, gold disappointed, ending the year at about $1,825, down about 3.6 percent.
So, is gold a good inflation hedge? The following example should help provide an answer. On January 21, 1980, the price of gold reached a then-record high of $850. On March 19, 2002, gold was trading at $293, well below where it was 20 years earlier. Note that the inflation rate for the period from 1980 through 2001 was 3.9 percent. Thus, gold’s loss in real purchasing power was about 85 percent. How can gold be an inflation hedge when over the course of 22 years it lost 85 percent in real terms? That said, gold has been a good hedge of inflation over the very long run, such as a century. Unfortunately, that’s a much longer investment horizon than that of most investors.
The conclusion you should draw is that while gold might protect against inflation in the very long run, 10 years or even 20 years is not the long run. Claude Erb and Campbell Harvey, authors of the 2015 study “The Golden Constant,” examined the historical evidence on gold as an inflation hedge and concluded: “While gold might protect against inflation in the very long run, 10 years is not the long run. In the shorter run, gold is a volatile investment which is capable and likely to overshoot or undershoot any notion of fair value.”
Lesson 5: The investment world isn’t flat, and the diversification of risky assets is as important as ever.
The financial crisis of 2008 caused the correlations of all risky assets to rise toward 1. This led many in the financial media to report on the “death of diversification”—because the world is now flat (interconnected), diversification no longer works. This theme has been heard repeatedly since 2008. Yet, diversification benefits come not just from correlations but from the dispersion of returns as well. And a wide dispersion of returns in almost every year since 2000 demonstrates there are still large diversification benefits:
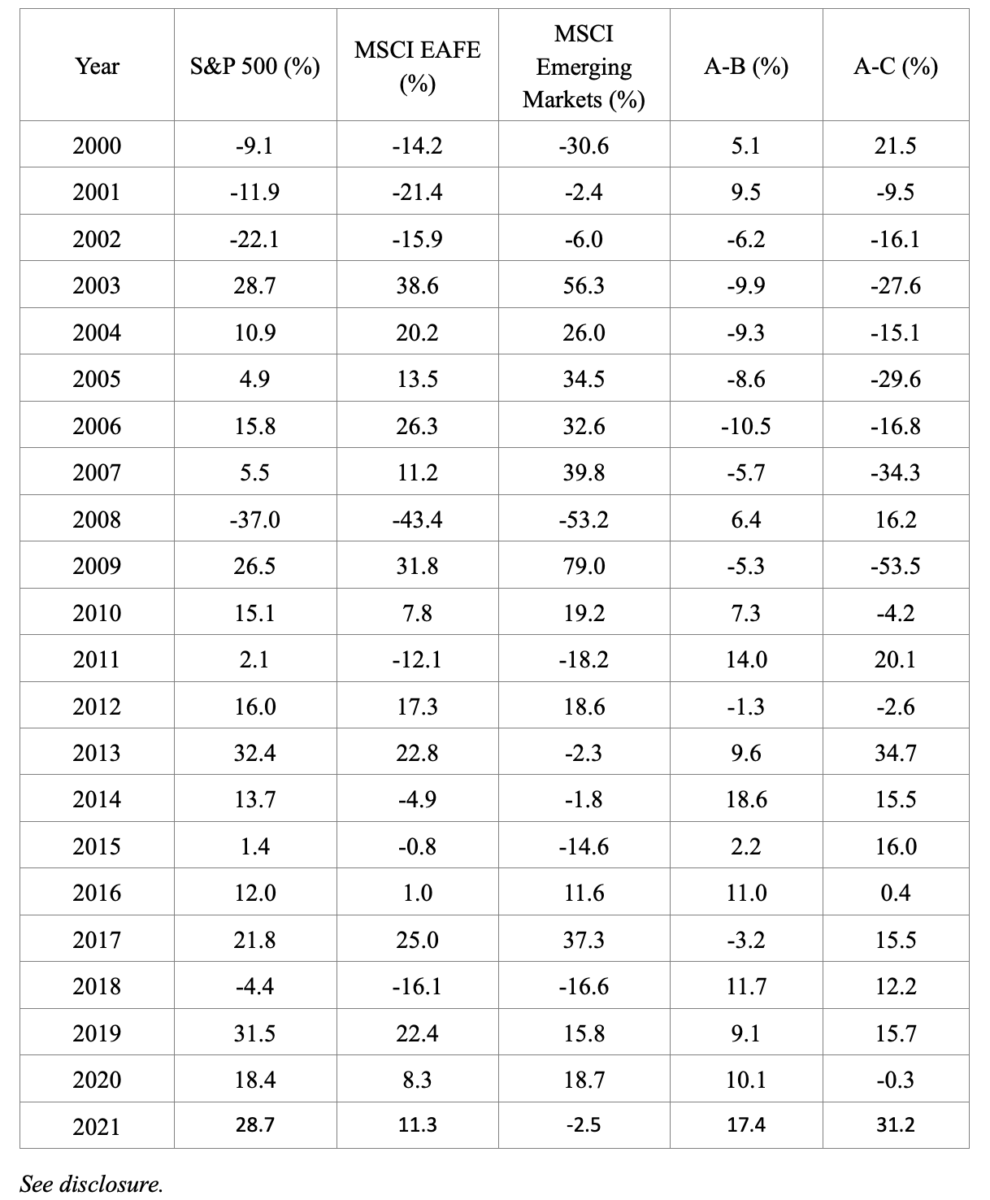
There were only three years of the 21 when the difference in returns between the S&P 500 Index and the MSCI EAFE Index was less than 5 percentage points. On the other hand, there were 14 years when it was at least 8 percentage points. There were also only three years when the return on the S&P 500 Index was within 10 percentage points of the return of the MSCI Emerging Markets Index. There were eight years when it was at least 20 percentage points and four when it was at least 30 percentage points. The largest gap was more than 53 percentage points. The data presents powerful evidence that the investment world is far from flat and that there are still significant benefits in international diversification.
We’ll bring you five more investment lessons the markets taught us in 2021 in the second and concluding part on Friday.
And if you would like to hear Larry discussing these investment lessons, listen to the latest TEBI Podcast.
For informational and educational purposes only and should not be construed as specific investment, accounting, legal, or tax advice. Certain information is based upon third party sources which may become outdated or otherwise superseded without notice. Third party information is deemed to be reliable, but its accuracy and completeness cannot be guaranteed. Indices are not available for direct investment. Their performance does not reflect the expenses associated with the management of an actual portfolio nor do indices represent results of actual trading. Total return includes reinvestment of dividends and capital gains. Mentions of securities are to demonstrate passive funds versus active funds, and low-cost funds. The mentions of specific securities should not be construed as recommendations of securities. Performance is historical and past performance is not an indication of future results. By clicking on any of the links above, you acknowledge that they are solely for your convenience, and do not necessarily imply any affiliations, sponsorships, endorsements, or representations whatsoever by us regarding third-party websites. We are not responsible for the content, availability, or privacy policies of these sites, and shall not be responsible or liable for any information, opinions, advice, products or services available on or through them. The opinions expressed by featured authors are their own and may not accurately reflect those of the Buckingham Strategic Wealth® or Buckingham Strategic Partners®, collectively Buckingham Wealth Partners. Neither the Securities and Exchange Commission (SEC) nor any other federal or state agency have approved, determined the accuracy, or confirmed the adequacy of this article. LSR-21-220
LARRY SWEDROE is Chief Research Officer at Buckingham Strategic Wealth and the author of numerous books on investing.
ALSO BY LARRY SWEDROE
Should you avoid fund providers’ model portfolios?
What impact have new accounting standards had on quant funds?
Carbon beta: what it is and why it’s useful
Does investing in sin stocks deliver a return premium?
How good are we at predicting our longevity?
How do environmental news stories affect stocks?
NEW INVESTOR?
If you’re new to investing, TEBI founder Robin Powell and fellow financial blogger Ben Carlson have written a book that you really ought to read. It’s called Invest Your Way to Financial Freedom, and it’s published by Harriman House.
Primarily written for a UK audience, the book has no hidden sales agenda and is based on peer-reviewed academic evidence. It explains, in simple terms, how young investors can develop good habits, save a fortune in unnecessary fees, and achieve financial freedom many years earlier than they otherwise would.
You can either buy the book direct from the publisher or via Amazon:
For those in the UK,
Buy the paperback via Harriman House here
Buy the paperback via Amazon here
Buy an audio version on Audible here
For those outside the UK,
Buy the Kindle version via Amazon here
© The Evidence-Based Investor MMXXII


