
This week, LARRY SWEDROE IS looking at ten investment lessons the financial markets have taught us over the last 12 months. We brought you the first five lessons on Tuesday. Here are the second five. And if you would like to hear Larry discussing these investment lessons, listen to the latest TEBI Podcast.
Lesson 6: Hedge funds are not investment vehicles; they are compensation schemes.
This one has been appearing as regularly as active management being a loser’s game. Hedge funds entered 2021 coming off their 12th straight year of trailing U.S. stocks (as measured by the S&P 500 Index). How did they do in 2021? The HFRX Global Hedge Fund Investable Index produced a total return of 3.7 percent.
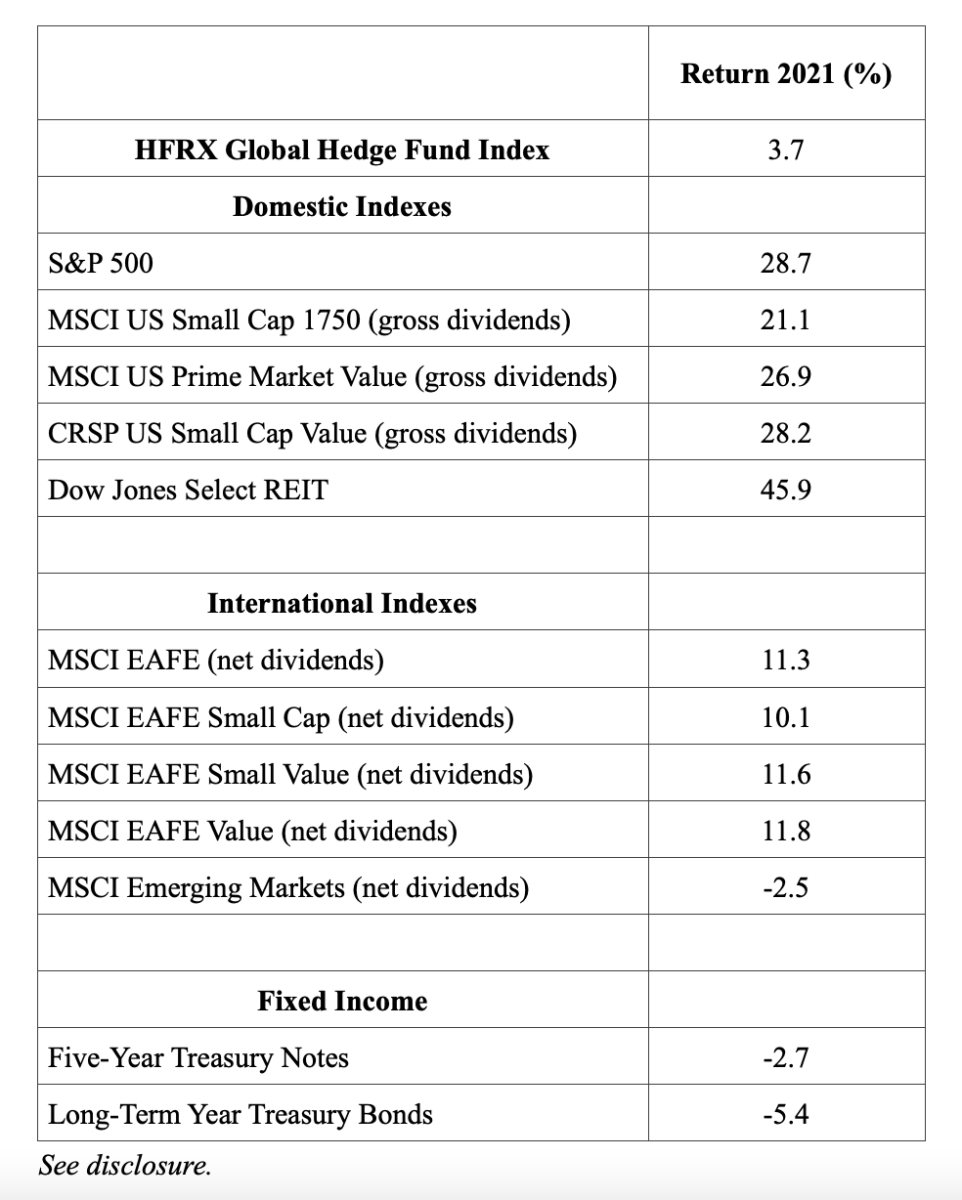
As you can see, the hedge fund index underperformed all major equity asset classes except emerging markets, though it outperformed the two bond indexes. We can take our analysis a step further to determine how hedge funds performed against a globally diversified portfolio.
An all-equity portfolio hypothetically allocated 50 percent internationally and 50 percent domestically, equally weighted among the indexes from the table within those broader categories, would have returned 19.3 percent, outperforming the hedge fund index by 15.6 percentage points.
Another comparison we can make is to a typical balanced portfolio of 60 percent equities and 40 percent bonds. Using the same weighting methodology as above for the equity allocation, the hypothetical portfolio would have returned 10.6 percent using five-year Treasuries (outperforming the hedge fund index by 6.9 percentage points) and 9.4 percent using long-term Treasuries (outperforming the hedge fund index by 5.7 percentage points).
Given the results and the wide dispersion of returns between U.S. and international equities, one might think hedge funds would have used their freedom to move across asset classes, which they often tout as their big advantage, to better effect.
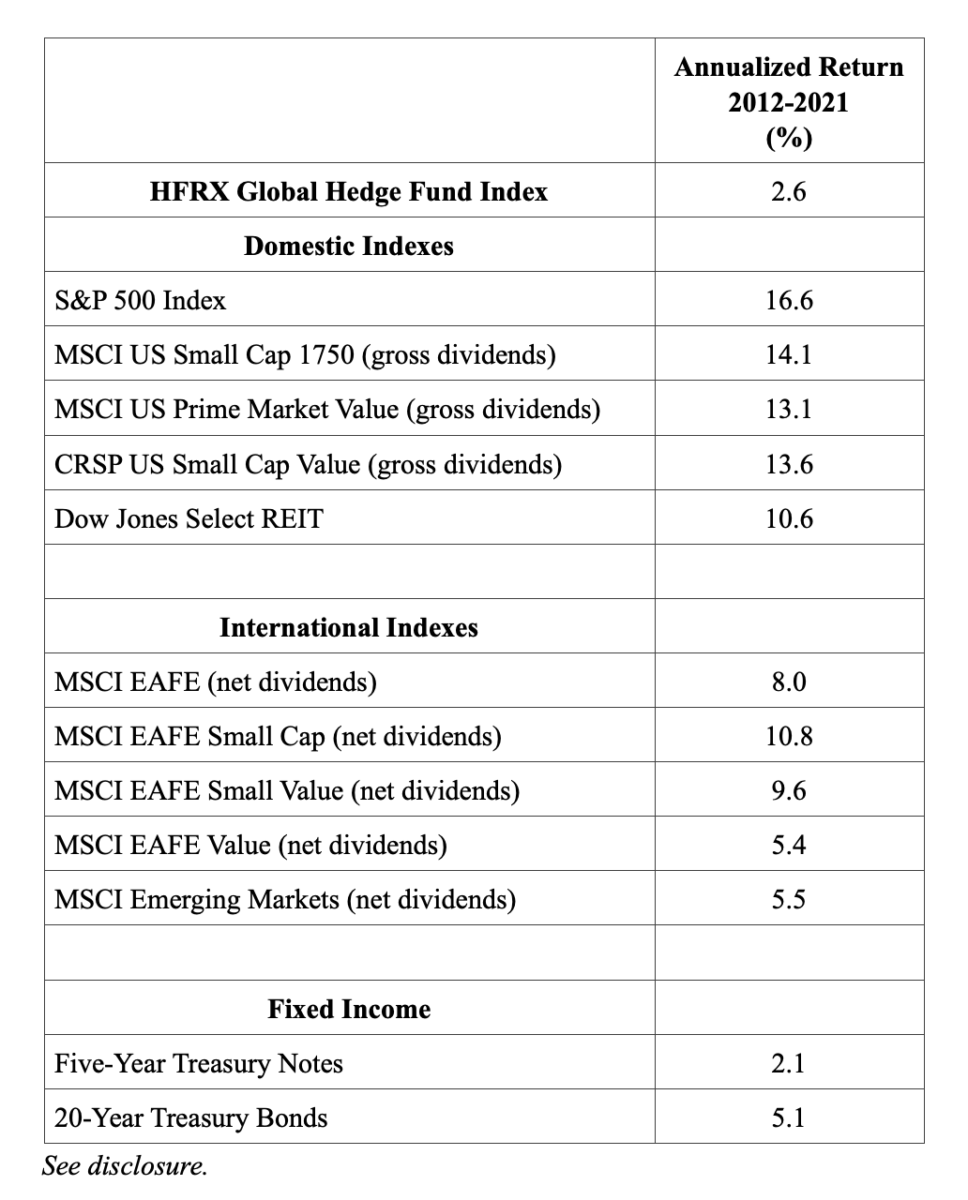
The problem is that the efficiency of the market, as well as the cost of the effort, can turn that supposed advantage into a handicap. Given the evidence on hedge funds’ underwhelming results, it’s puzzling that they are still managing about $3 trillion in assets, especially in light of their longer-term performance.
As illustrated in the following table, over the 10-year period ending December 2021, they underperformed every single major equity asset class by wide margins. They also outperformed five-year Treasuries by just 0.5 percentage point and underperformed intermediate and long-term Treasuries.
The results are the same when we look at the last 20 years, with the hedge fund index underperforming every major equity asset class and even underperforming five-year Treasuries by 1.7 percentage points.
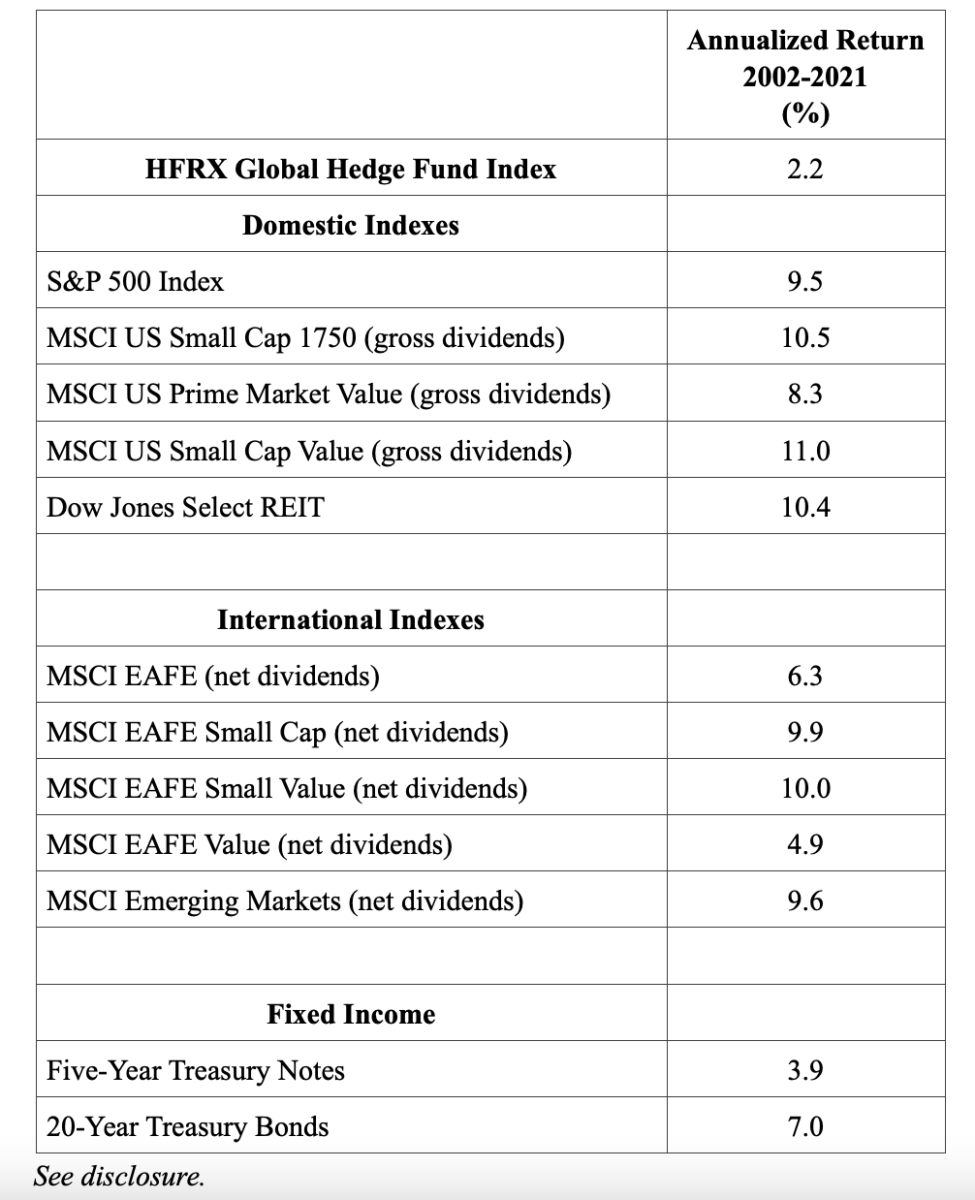
The evidence demonstrates that the market has been persistently teaching investors that, on average, the only objective hedge funds have achieved is transferring assets from investors to the fund sponsors.
Lesson 7: The correlation of returns of stocks and bonds is time varying.
From 1926 through 2021, using Ken French’s Data Library, the monthly correlation of the S&P 500 Index to long-term (20-year) Treasury bonds has been close to zero (0.06). A zero correlation means that when stock returns are higher (lower) than their historical average, bond returns are just as likely to be higher or lower than their historical average. Thus, it has been close to a coin toss whether long-term Treasury bonds will provide higher (lower) returns than their historical average when the S&P 500 does so. And correlations are time varying.
In 2021, while VOO (Vanguard’s S&P 500 ETF) returned 28.8 percent, VGLT (Vanguard’s Long-Term Treasury ETF) lost 5.0 percent. On the other hand, in 2008 the S&P 500 lost 37 percent, while long-term Treasury bonds returned almost 26 percent. Investors should also be aware that they can both produce negative returns at the same time. There have been five years when both the S&P 500 Index and long-term Treasury bonds produced negative returns (1931, 1969, 1973, 1977 and 2018). The worst of those years was 1969, when the S&P 500 lost 8.5 percent and long-term Treasury bonds lost 5.1 percent. There have now been 21 years when the S&P 500 produced a positive return and long-term bonds produced negative returns. And finally, there have been 18 years when the S&P 500 produced negative returns and long-term bonds produced positive returns.
The lesson is that correlations are time varying. And given the historically high valuations of stocks and the historically low level of interest rates, investors should not lose sight of the fact that there have been times when longer-term bonds have not provided shelter from the storm-rocking equities.
Lesson 8: Don’t let your political views influence your investment decisions.
One of my more important roles as chief research officer at Buckingham Wealth Partners involves helping prevent investors from committing what I refer to as “portfolio suicide”—panicked selling resulting from fear, whatever its source. The lesson to ignore your political views when making investment decisions is one that rears its head after every presidential election. The election of 2020 was no exception.
We often make mistakes because we are unaware that our decisions are being influenced by our beliefs and biases. The first step to eliminating, or at least minimising, such mistakes is to become aware of how our choices are impacted by our views, and how those views can influence outcomes. The 2012 study Political Climate, Optimism, and Investment Decisions, by Yosef Bonaparte, Alok Kumar and Jeremy Page, showed that people’s optimism toward both the financial markets and the economy is dynamically influenced by their political affiliation and the existing political climate. These were among the authors’ findings:
- Individuals become more optimistic and perceive the markets to be less risky and more undervalued when their preferred party is in power. This leads them to take on more risk, overweighting riskier stocks. They also trade less frequently. That’s a good thing, as the evidence demonstrates that the more individuals trade, the worse they tend to do.
- When the opposite party is in power, individuals’ perceived uncertainty levels increase and investors exhibit stronger behavioral biases, leading to poor investment decisions.
Now, imagine the nervous investor (and I had discussions with many of them, all of whom were Republicans) who reduced their allocation to equities (or even eliminated them) based on views about the Biden presidency, Democratic control of the House of Representatives and Vice-President Harris being able to break a tie in the Senate. While investors who stayed disciplined benefited from the market’s very strong performance, those who panicked and sold not only missed out on that strong performance, but they have persistently faced (and continue to face) the incredibly difficult task of figuring out when it would once again be safe to invest. Similarly, I know of many investors with Democratic leanings who were underinvested once President Trump was elected.
The December 2016 Spectrem Affluent Investor and Millionaire Confidence surveys provided evidence of how political biases can impact investment decisions. Prior to the 2016 election, with a victory for Hillary Clinton expected, those identified as Democrats showed higher confidence than those who identified as Republicans or Independents. This completely flipped after the election. Those identified as Democrats registered a confidence reading of -10, while Republicans and Independents showed confidence readings of +9 and +15, respectively.
If you lose confidence and sell, there’s never a green flag that will let you know when it’s safe to get back in. Thus, the strategy most likely to allow you to achieve your goals is to have a plan that anticipates problems and will not take more risk than you have the ability, willingness and need to assume. Additionally, don’t pay attention to the news if doing so will cause your political beliefs to influence your investment decisions.
Lesson 9: Diversification is always working; sometimes you like the results and sometimes you don’t.
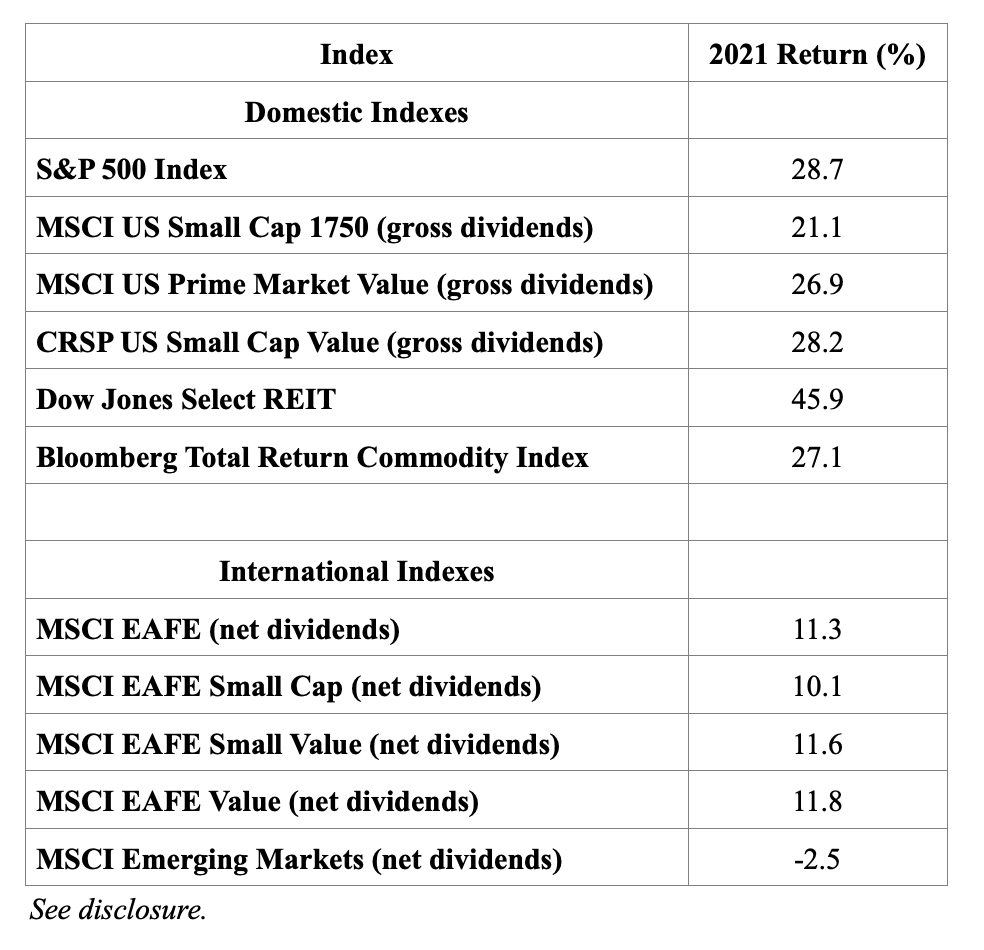
Everyone is familiar with the benefits of diversification. It’s been called the only free lunch in investing because, done properly, it reduces risk without reducing expected returns. However, once you diversify beyond a popular index such as the S&P 500, you must accept the fact that you will almost certainly be faced with periods (even long ones) when a popular benchmark index, reported by the media on a daily basis, outperforms your more diversified portfolio. The noise of the media will then test your ability to adhere to your strategy.
Of course, no one ever complains when their diversified portfolio experiences positive tracking variance (i.e., it outperforms the popular benchmark). The only time you hear complaints is when it experiences negative tracking variance (i.e., it underperforms the benchmark). As the table below demonstrates, 2021 was just such a year.
Lesson 10: The strategy to sell in May and go away is a myth.
One of the more persistent investment myths is that the winning strategy is to sell stocks in May and wait until November to buy back into the market. Let’s look at the historical evidence. Since 1926 it is true that stocks have provided greater returns from November through April than they have from May through October. That may be the source of the myth. The average premium of the S&P 500 Index over one-month Treasury bills was 8.8 percentage points per year from November 1926 through October 2021. And the average premium of the portfolio from November through April was 5.9 percent compared to just 2.6 percent for the May through October portfolio. In other words, the equity risk premium from November through April has been more than twice the premium from May through October. Furthermore, the premium was negative more frequently for the May through October portfolio, with 33 percent of the six-month periods having a negative result compared to 27 percent of the six-month periods for the November through April portfolio.
From November 1926 through October 2021, the S&P 500 Index returned 10.5 percent per year. Importantly, the May through October portfolio had a positive equity risk premium of 2.6 percent per year, which means the portfolio still outperformed Treasury bills on average. In fact, a strategy that invested in the S&P 500 Index from November through April and then invested in riskless one-month Treasury bills from May through October would have returned 8.5 percent per year over this period, underperforming the S&P 500 Index by 2.0 percentage points per annum. And that’s even before considering any transactions costs, let alone the impact of taxes (you’d be converting what would otherwise be long-term capital gains into short-term capital gains, which are taxed at the same rate as ordinary income).
Let’s see how the strategy performed in 2021. The S&P 500 Index returned 10.9 percent from May through October, outperforming riskless one-month Treasury bills (which returned 0 percent) by 10.9 percentage points.
What’s perhaps most interesting is that the last year the “sell in May” portfolio outperformed the consistently invested portfolio was 2011. Yet, you can be sure that, come next May, the financial media will be raising the myth once again.
A basic tenet of finance is that there’s a positive relationship between risk and expected return. To believe that stocks should produce lower returns than Treasury bills from May through October, you would also have to believe that stocks are less risky during those months — a nonsensical argument. Unfortunately, as with many myths, this one seems hard to kill off.
Summary
Even smart people make mistakes. What differentiates them from fools is that they don’t repeat them, expecting different outcomes. 2022 will surely offer us more lessons, many of which will be remedial courses. The market will provide opportunities to make investment mistakes. You can avoid making errors by knowing your financial history and having a well-thought-out plan. Reading my book Investment Mistakes Even Smart People Make and How to Avoid Them will help prepare you with the wisdom you need. And consider including in your New Year’s resolutions that you will learn from the investment lessons the market teaches.
My greatest hope is that you have learned that the key to successful investing is to get the plan right in the first place, and then stick to it. That means imitating the lowly postage stamp, which does one thing but does it well — sticking to its letter until it reaches its destination. Your job is to stick to your well-developed plan until you reach your financial goals. And if you don’t have a plan, write one immediately. And make sure the plan includes the actions you are prepared to take if the “unexpected” happens (your “Plan B”).
For informational and educational purposes only and should not be construed as specific investment, accounting, legal, or tax advice. Certain information is based upon third party sources which may become outdated or otherwise superseded without notice. Third party information is deemed to be reliable, but its accuracy and completeness cannot be guaranteed. Indices are not available for direct investment. Their performance does not reflect the expenses associated with the management of an actual portfolio nor do indices represent results of actual trading. Total return includes reinvestment of dividends and capital gains. Mentions of securities are to demonstrate passive funds versus active funds, and low-cost funds. The mentions of specific securities should not be construed as recommendations of securities. Performance is historical and past performance is not an indication of future results. By clicking on any of the links above, you acknowledge that they are solely for your convenience, and do not necessarily imply any affiliations, sponsorships, endorsements, or representations whatsoever by us regarding third-party websites. We are not responsible for the content, availability, or privacy policies of these sites, and shall not be responsible or liable for any information, opinions, advice, products or services available on or through them. The opinions expressed by featured authors are their own and may not accurately reflect those of the Buckingham Strategic Wealth® or Buckingham Strategic Partners®, collectively Buckingham Wealth Partners. Neither the Securities and Exchange Commission (SEC) nor any other federal or state agency have approved, determined the accuracy, or confirmed the adequacy of this article. LSR-21-220
OUR SISTER BLOGS
If you’re a financial adviser or planner and you enjoy TEBI’s articles, why not try our sister blogs, Adviser 2.0 and Evidence-Based Advisers?
Picture: Luca Bravo via Unsplash
© The Evidence-Based Investor MMXXI


