
By CRAIG LAZZARA
With the first half of 2022 in the books, commentators have noted that this year’s -20.0% total return for the S&P 500 is the worst January-June result in more than 50 years. Painful as the first six months were, what might they tell us about the rest of the year?
History gives us both bad news and good news. Bad news first: the correlation between the past six months’ return and the next six months’ return is vanishingly small. Predictions are problematic. Exhibit 1 illustrates this for the S&P 500; results for the S&P MidCap 400® and S&P SmallCap 600 are comparable. (The data here encompass not just the first six months of the year, but every six-month period from 1995 onward.)
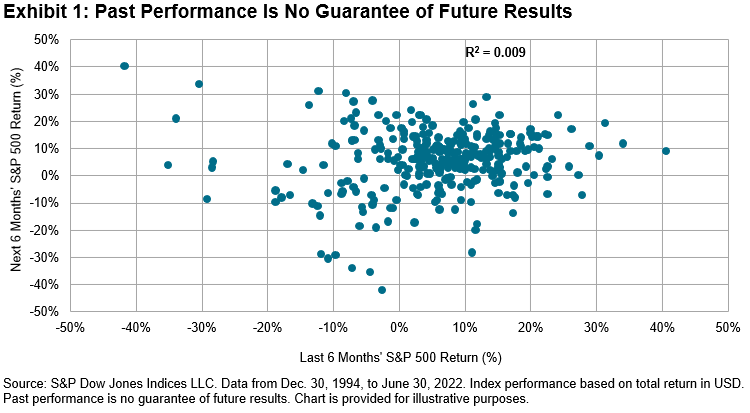
In general, knowing how well or poorly an index did in the past six months tells you nothing about how well or poorly it will do over the next six months.
But… with a little legerdemain, we can tease out some good news as well. The fact that returns have been above average, or below average, does not help us forecast what returns will be going forward. This means that regardless of what has already happened, the next six months’ return is best regarded as a random draw from the same distribution that generated the last six months’ return.
We can use this insight by sorting the data points in Exhibit 1 into deciles based on the last six months’ performance. Within each decile, we can measure the average monthly performance in the last six months and the next six months. The difference between the next six months and the last six months represents the improvement (or worsening) of performance by decile and is graphed in Exhibit 2.
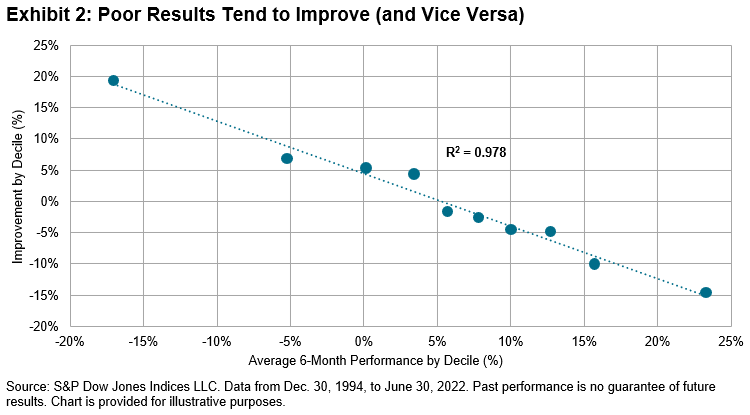
On one level, Exhibit 2 is just a demonstration of mean reversion in action. But it also has a practical implication: if historical returns have been especially good, future returns are likely to be worse, and if historical returns have been especially bad, future returns are likely to be better. At the end of June 2022, historical results across the capitalisation range were indeed especially bad, as Exhibit 3 illustrates.
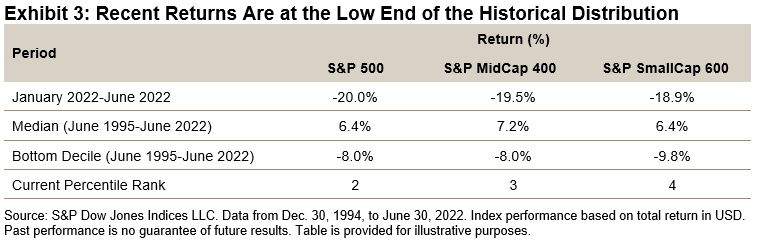
There are no guarantees, but history tells us that when returns are as bad as the first half of 2022’s have been, improvement has been much more frequent than continued decline. When returns have been especially bad, patience tends to be especially valuable.
CRAIG LAZZARA is Managing Director and Global Head of Index Investment Strategy at S&P Dow Jones Indices.
This article was first published on the Indexology blog.
MORE FROM S&P DJI
For more valuable insights from S&P Dow Jones Indices, you might like to read these other recent articles:
Which types of stocks have fared best in 2022?
Is outperformance down to luck or skill?
Why have large-cap growth funds performed so badly?
2021 was third-worst year on record for US active managers
Will 2022 be a better year for active managers?
© The Evidence-Based Investor MMXXII


