
As someone who has spent many years studying fund performance, CRAIG LAZZARA from S&P Dow Jones indices expects to see most active managers underperform index benchmarks most of the time. But when 99% of all large-cap growth managers underperformed in 2021, even Craig admits to being surprised. What produced the perfect storm?
Anyone familiar with our SPIVA reports will realise that most active managers fail most of the time. In 21 years of SPIVA data, a majority of large-cap managers underperformed the S&P 500 18 times; the most recent of the three exceptions came in 2009. Even in that context, 2021 was a year of above-average difficulty, as 85% of large-cap active managers lagged the benchmark — their second-worst performance ever (exceeded only by 2014’s dismal record).
Even in a difficult year, SPIVA data can sometimes yield nuggets of optimism for active managers. In 2021, e.g., only 38% of large-cap value managers lagged the S&P 500 Value Index. Growth, up 32%, handily outperformed Value (up 25%), creating an opportunity for value managers to benefit from style drift, as they are sometimes wont to do. On the other hand, 99% of large-cap growth managers lagged the S&P 500 Growth Index — an unprecedented level of underperformance, and hardly explained by the absence of opportunities to drift.
We’ve often argued that the skewness of equity returns helps explain the persistent frustration of active managers — in most years, only a minority of stocks outperform the index, making stock selection more difficult than it would be with equal numbers of out- and under-performers. Growth managers in 2021 were doubly hurt by skewness: of the 230 constituents of the S&P 500 Growth Index, only 96 outperformed. It’s hard to be a successful stock picker when only 42% of your names outperform, and it’s even harder when the outperformers are concentrated at the upper end of the capitalisation scale.
Exhibit 1 divides the constituents of the S&P 500 Growth Index into quintiles by capitalisation, and then compares the weighted average performance of the stocks in each quintile.
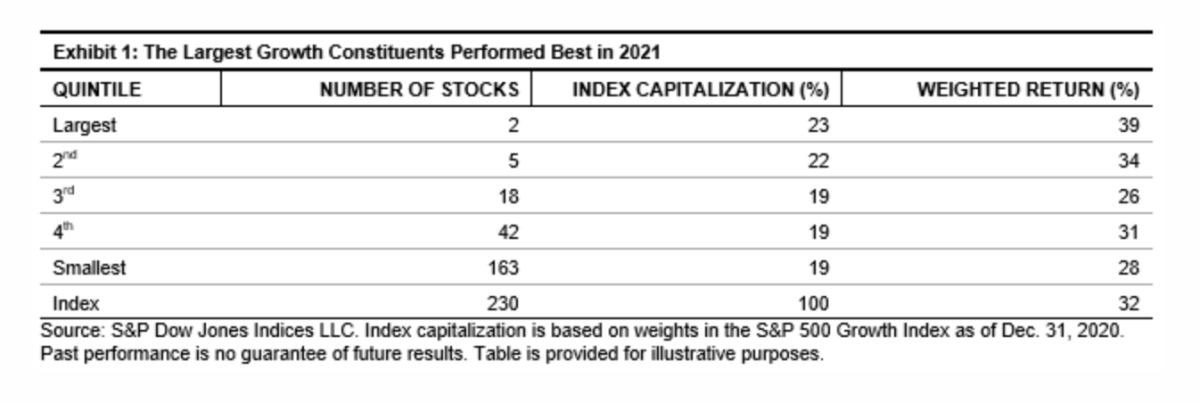
Although not strictly monotonic, there’s a clear relationship: larger growth stocks outperformed smaller in 2021. In fact, only the two largest capitalisation quintiles outperformed the S&P 500 Growth Index, and those two quintiles comprise only seven stocks. At the top, Apple and Microsoft were the most important contributors to the index’s return in 2021; their combined weight was 23%. Only a rare active manager is willing or able to overweight names that large. Overweighting the five stocks in the second capitalisation quintile, with an average weight of 4.3%, might also be problematic. For most growth managers, professional caution combined with client diversification guidelines would have made overweighting stocks in the top two quintiles difficult if not impossible.
Viewed from this perspective, it’s not surprising that virtually all large-cap growth managers underperformed in 2021. A growth manager’s ability to outperform was contingent on overweighting the names that would have been hardest to overweight.
CRAIG LAZZARA is Managing Director and Global Head of Index Investment Strategy at S&P Dow Jones Indices.
MORE FROM S&P DJI
For more valuable insights from S&P Dow Jones Indices, you might like to read these other recent articles:
2021 was third-worst year on record for US active managers
Will 2022 be a better year for active managers?
Putting value’s two-month winning streak in context
What are the perfect conditions for active management?
Why active managers struggled yet again in 2021
THE PODCAST
Have you discovered The TEBI Podcast? You’ll find it on SoundCloud, Spotify, Apple Podcasts, Podbean or your preferred podcast provider.
© The Evidence-Based Investor MMXXII


