
After years of Growth dominance, Value indices have staged a furious recovery for the last two months. Of course, there’s no way of telling for how long Value’s outperformance will last. By historical standards, however, CRAIG LAZZARA from S&P Dow Jones Indices says there’s still plenty of scope for it to continue.
This year marks the 30th anniversary of the launch of indices designed to distinguish growth and value investment styles. Investment managers had classified themselves as growth or value specialists (among other possible differentiators) before 1992, but until then it wasn’t possible to evaluate a value manager against a systematically defined value benchmark or a growth manager against a growth benchmark. (Such comparisons have not generally been happy ones for active managers, but that’s a story for another day.) As with the S&P 500®, style indices, used initially as benchmarks, also came to underlie investment products by which growth and value exposure could be indicised.
Exhibit 1 compares the performance of the S&P 500 Growth Index and the S&P 500 Value Index. When the line on the graph is rising, Growth is outperforming Value, and vice versa when the line is falling.
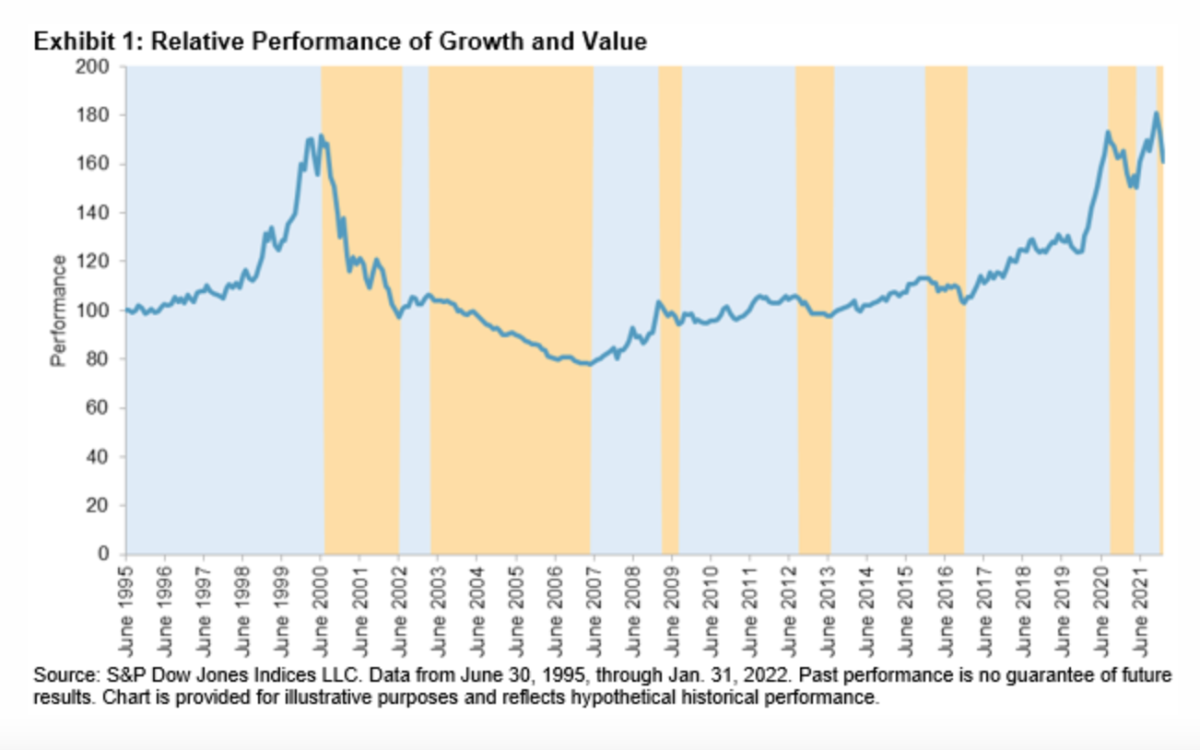
Growth has outperformed since 1995, although it’s obvious that leadership has shifted between the two styles periodically. Given that the last 10 years have been largely dominated by Growth, and given the historical tendency for leadership to rotate, it’s not surprising that many market participants wonder when Value will once again take the lead. It has been a frustrating wait.
I confess that I am among the frustrated. Observing that between September 2020 and May 2021 Value (up 31.6%) had outperformed Growth (up 14.2%), I brazenly suggested that perhaps the long-awaited turn had come. My temerity was rewarded by a six-month streak in which Growth outperformed Value in five months. (The final score was Growth 19.1%, Value -0.8%.)
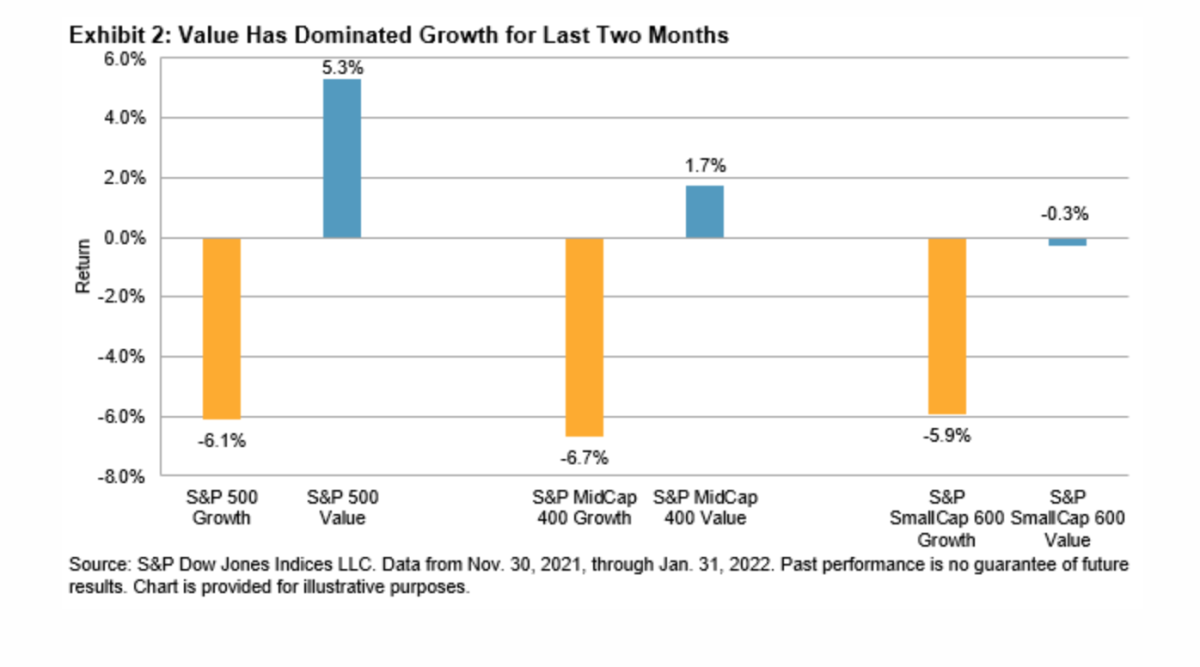
But since the beginning of December 2021, Value has once again assumed the lead. For the last two months, S&P 500 Value has scored a total return of 5.3%, while S&P 500 Growth has lost 6.1%. As Exhibit 2 makes clear, Value has dominated Growth across the capitalisation range.
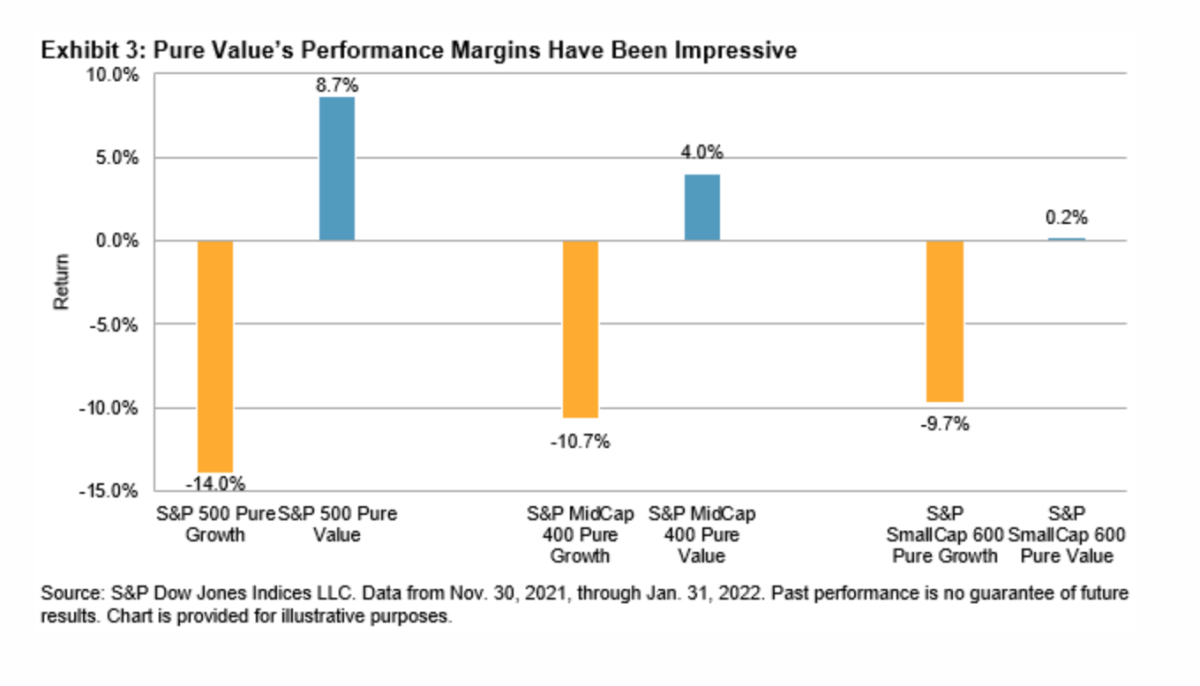
Most style index series are designed so that growth and value together compose the parent index; this necessitates their holding some stocks that are not obviously in either the growth or value camp. For clients who prefer a more concentrated approach to style, the S&P 500 Pure Value Index includes only names with the highest value scores, and analogously for the S&P 500 Pure Growth Index. Historically, when Value is outperforming Growth, typically Pure Value is outperforming Pure Growth by more, and Exhibit 3 shows that this pattern has continued during Value’s recent recovery.
Of course, we don’t know how long Value’s dominance will last — the historical record has included periods as short as six months (March-August 2009) and as long as 50 months (April 2003-May 2007). Owners of value indices obviously hope for the latter outcome, but even the former leaves room for additional outperformance.
CRAIG LAZZARA is Managing Director and Global Head of Index Investment Strategy at S&P Dow Jones Indices.
MORE FROM S&P DJI
For more valuable insights from S&P Dow Jones Indices, you might like to read these other recent articles:
What are the perfect conditions for active management?
Why active managers struggled yet again in 2021
Is today’s market conducive to successful active management?
Reasons for optimism post COP26
How will a strengthening dollar affect emerging markets?
© The Evidence-Based Investor MMXXII


