
By LARRY SWEDROE
Mutual funds (a type of institutional investor) are generally considered “smart money” that exploits the behavioral biases of “dumb” retail money. Recently, however, some holes have been poked in that bit of conventional wisdom. For example, Roger Edelen, Ozgur Ince and Gregory Kadlec, authors of the 2016 study Institutional Investors and Stock Return Anomalies, found that mutual funds exhibit more buying of overvalued (short leg) stocks than undervalued (long leg) stocks for many well-known anomalies. This surprising finding was in sharp contrast to prior research on performance, the difference arising from the horizon period studied. They confirmed this horizon effect, finding a significant positive relation between quarterly changes in institutional holdings and next-quarter returns that turned significantly negative as the time horizon extended to a year or longer. Thus, they concluded that “while institutional trades seem to be informed when evaluated over short horizons, that assessment seems premature when evaluated over a longer horizon”.
Their findings suggest that mutual funds actually fail to exploit well-known anomalies. Instead, they contribute to their persistence. Thus, the short-term outperformance may not be the result of a “smart money” effect but instead a result of the price pressure associated with persistent institutional trading, as opposed to informed trading.
This hypothesis is consistent with the findings of George Jiang and H. Zafer Yuksel, authors of the 2017 study What Drives the ‘Smart-Money’ Effect? Evidence from Investors’ Money Flow to Mutual Fund Classes. By studying mutual fund flows for retail (unsophisticated) and institutional (sophisticated) investors, they found that short-term persistence in performance was not due to the so-called smart money effect but was instead caused by persistent flow. And the persistence of short-term performance then experiences a long-term reversal. In other words, mutual funds are also noise traders that can contribute to mispricings.
Because someone owns the long leg of the anomalies, it begs the question: Who is exploiting these well-known anomalies? Mustafa Onur Caglayan and Umut Celiker, authors of the 2017 study Hedge Fund vs. Non-Hedge Fund Institutional Demand and the Book-to-Market Effect, found that hedge funds (another type of institutional investor) were the ones buying the long side of the anomalies; they were the smart money. They also found that the evidence showed a stronger ability for hedge funds to detect overpriced securities compared to underpriced securities. This aligns with the theory of limits to arbitrage and short-sale constraints, which allow mispricings to persist even after publication. While the evidence shows that hedge fund managers are skilled, the historical evidence also demonstrates that they keep any “economic rent” (as you would expect because the ability to generate alpha is the scarce resource) that results from their skill.
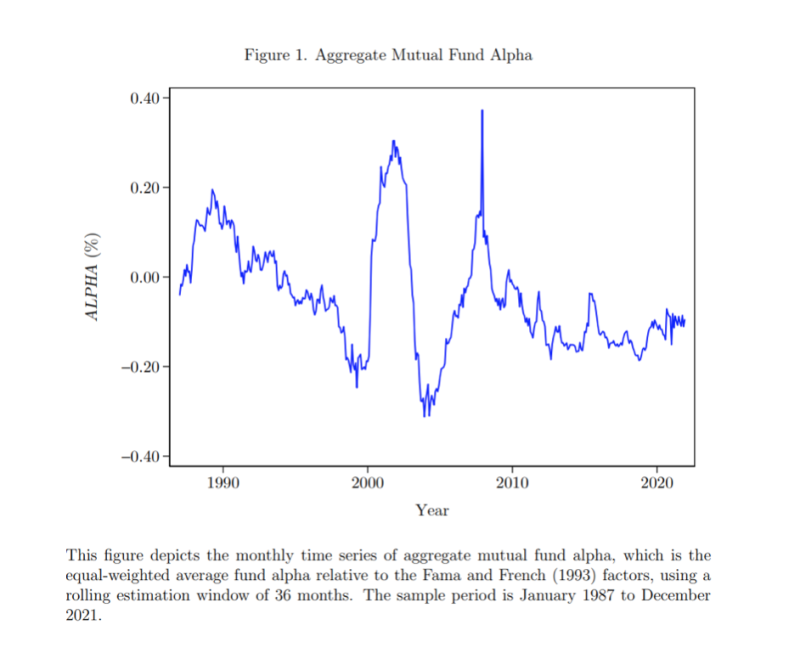
Motivated by the surprising findings that mutual funds as a whole have a tendency to buy stocks that comprise the short legs of numerous anomalies, Trevor Young, author of the August 2022 study The Information Content of Aggregate Mutual Fund Alpha, examined the information content of aggregate mutual fund alpha, focusing on its relation with expected returns on the stock market. His hypothesis was that if the “overvalued” stocks that funds buy continue to appreciate, that might signal greater market overvaluation—while theory is unclear about how long mispricing takes to correct, it should ultimately resolve.
To test his hypothesis, Young examined the relation between aggregate alpha and the cross-section of returns using the long-short combination anomaly portfolio from the 2017 study Mispricing Factors in which Robert Stambaugh and Yu Yuan identified 11 anomalies:
- Failure Probability (Distress): Stocks with a high probability of failure have lower future returns.
- O-score: Stocks with higher O-scores (a higher probability of bankruptcy) have lower future returns compared to stocks with lower scores.
- Net Stock Issuances: The stocks of firms that issue equity underperform the stocks of non-issuers.
- Composite Equity Issuance: Firms with higher equity issuance underperform firms with lower measures.
- Accruals: Stocks with high accruals underperform stocks with low accruals.
- Net Operating Assets: Stocks with higher net operating assets underperform stocks with lower net operating assets.
- Momentum: Stocks with higher past performance outperform stocks with lower past performance.
- Gross Profitability: Stocks with higher gross profitability have higher future returns.
- Asset Growth: Stocks with higher asset growth have lower future returns.
- Return on Assets: Stocks with higher return on assets have higher future returns.
- Investment-to-Assets: Stocks with higher past investment (scaled by total assets) have lower future returns.
Young calculated the equal-weighted average alpha of actively managed equity mutual funds relative to the Fama-French three factors (market beta, size and value) over a 36-month window as well as to the Carhart four factors (adding momentum) and the Fama-French five factors (beta, size, value, investment and profitability). He also benchmarked returns relative to a popular set of monthly macroeconomic variables that have been shown to predict future market returns, including dividend-to-price, earnings-to-price, net equity issuance, Treasury bill rate, Treasury bond yields, credit spreads and inflation.
His data sample was U.S. mutual fund returns from the Center for Research in Security Prices (CRSP) Survivor-Bias-Free Mutual Funds database and Thomson Financial Mutual Fund Holdings and covered the period 1987-2021. Following is a summary of his findings:
- The average alpha of actively managed mutual funds was -0.04 percent per month with a standard deviation of 0.13 percentage points, consistent with the general finding that funds tend to have negative risk-adjusted returns.
- Fluctuations in aggregate alpha track mispricing episodes like the internet and housing bubbles reasonably well, an indication that aggregate alpha captures variation in market mispricing.
- Aggregate alpha was a strong negative predictor of future market returns at horizons ranging from one month to two years, consistent with diminishing overvaluation that has a long-run effect on the market.
- The predictive power increased monotonically with horizons up to 18 months into the future before gradually losing economic and statistical significance at horizons beyond 24 months—consistent with limits to arbitrage preventing immediate price correction.
- When aggregate alpha was more than one standard deviation below its historical mean, the subsequent excess market return (return above the risk-free rate) averaged 0.80 percent per month (the average excess return over the full sample period was 0.73 percent per month). In contrast, it averaged a significantly lower -0.59 percent per month when aggregate alpha was more than one standard deviation above its historical mean—market returns tended to be particularly poor after periods of high aggregate alpha.
- The adjusted R-squared increased with the horizon before declining, with the highest adjusted R-squared of 17 percent occurring at both the nine- and 12-month horizons.
- A one-standard-deviation increase in aggregate alpha was associated with a statistically significant (at the 1 percent confidence level) 0.63 percentage point per month (roughly 7.5 percentage points per year) reduction in future excess market returns.
- The negative relation between aggregate alpha and future market returns held for funds tilting toward overvalued stocks but not for funds tilting toward undervalued stocks, suggesting that aggregate alpha predominantly captures mispricing in the form of overpricing.
- Anomaly returns were significantly higher following an increase in aggregate alpha—a one-standard-deviation increase in aggregate alpha was associated with a statistically significant (at the 5 percent confidence level) 0.33 (2.98) percentage point increase in anomaly returns in the following month (year).
- The findings were robust to sub-periods, controlling for macroeconomic variables, and to the various factor models.
- Stocks tended to experience significantly lower earnings surprises after an increase in aggregate alpha, suggesting that analysts are overly optimistic about cash-flow prospects during periods of higher aggregate alpha and thus are negatively surprised when the actual unanticipated earnings become publicly available. The evidence is consistent with the view that mispricing related to errors in cash-flow expectations is a key driver of the predictability of aggregate alpha for future market returns.
- Using active share (the proportion of fund holdings that differ from the fund benchmark) and tracking error (the standard deviation of the difference between the fund return and its benchmark return), the negative predictive power of aggregate alpha for future market returns exists for funds with both high and low benchmarking constraints—benchmark constraints do not explain the findings.
- The findings were not driven by fund flows, which have been shown to predict variation in future returns for the stocks held by funds.
- The negative market return predictability of aggregate alpha existed for funds with both retail and institutional clientele — the findings do not stem solely from retail investors and their preferences for speculative stocks.
- The negative relation between aggregate alpha and subsequent market returns exists for small-cap and growth funds but not for mid-cap or income funds, supporting a behavioral explanation — the predictability indeed concentrates in styles especially prone to cognitive errors and thus pricing errors.
These findings are consistent with those of Doron Avramov, Si Cheng and Allaudeen Hameed, authors of the 2019 study Mutual Funds and Mispriced Stocks, who found that funds with high exposure to overpriced stocks underperform funds with low exposure to overpriced stocks.
Young’s findings led him to conclude: “Consistent with the hypothesis that aggregate alpha is a measure of market overvaluation, I find that aggregate alpha is a powerful negative predictor of future market returns. The results are robust to controlling for well-known macro-economic variables, out-of-sample tests, and methodological changes. The predictability indeed stems from funds tilting toward overvalued stocks and small-cap or growth styles. Furthermore, aggregate alpha predicts future anomaly returns and aggregate earnings surprises in a manner consistent with a mispricing explanation. Ancillary evidence shows that rational explanations related to benchmarking, flow, or catering appear insufficient to account for the results.” He added: “Since I show that fund performance tends to peak in advance of poor market performance, this paper offers a warning to not only those invested in funds but also to investors generally: times when funds earn their largest alpha are not necessarily when mispricing corrects but instead when it worsens.”
Investor takeaways
We now have a substantial body of evidence demonstrating that, in aggregate, actively managed mutual funds tend to overweight the short leg of anomalies rather than attempting to exploit the anomalies by overweighting the long side. That’s the first warning. The second is that the evidence is consistent with active mutual fund managers being subject to many of the same biases as retail investors — biases that negatively impact outcomes over the long term. Young provided investors with a third important (see here and here) warning, the tendency for individual investors to be prone to recency bias: fund performance tends to peak in advance of poor performance. Forewarned is forearmed.
For informational and educational purposes only and should not be construed as specific investment, accounting, legal, or tax advice. Certain information is based upon third party data and may become outdated or otherwise superseded without notice. Third party information is deemed to be reliable, but its accuracy and completeness cannot be guaranteed. By clicking on any of the links above, you acknowledge that they are solely for your convenience, and do not necessarily imply any affiliations, sponsorships, endorsements or representations whatsoever by us regarding third-party websites. We are not responsible for the content, availability or privacy policies of these sites, and shall not be responsible or liable for any information, opinions, advice, products or services available on or through them. The opinions expressed by featured authors are their own and may not accurately reflect those of Buckingham Strategic Wealth® or Buckingham Strategic Partners®, collectively known as Buckingham Wealth Partners. Neither the Securities and Exchange Commission (SEC) nor any other federal or state agency have approved, determined, or confirmed the adequacy of this article. LSR-22-371
LARRY SWEDROE is Chief Research Officer at Buckingham Strategic Wealth and the author of numerous books on investing.
ALSO BY LARRY SWEDROE
Man versus machine: Do funds powered by AI outperform?
Testing the patience of value investors
New study highlights 20 years of failure for active managers
Even with index funds, look beyond the expense ratio
Identifying winning funds ex ante: Is it possible?
NEED AN ADVISER?
t’s at times such as these that a good financial adviser comes into their own. If you don’t already have one, we may be able to help.
Wherever you are in the world, we will try to put you in contact with an adviser in your area whom we know personally, who shares our evidence-based investment philosophy and who we feel is best able to help you. If we don’t know of anyone suitable we will tell you.
We’re charging advisers a small fee for each successful referral, which will help to fund future content.
Click here and let’s get started.
© The Evidence-Based Investor MMXXII


