
By LARRY SWEDROE
Patience: A quality apparent among such lower life forms as snails and tortoises but rarely among humans who invest in financial assets.
— Jason Zweig, The Devil’s Dictionary
The decade from 2012 through 2021 provided a test of the faith and discipline for value investors as the Fama-French U.S. Growth Research Index outperformed the Fama-French U.S. Value Research Index by 4.6 percentage points per year (19.3 percent versus 14.7 percent), with most of that underperformance occurring during the four years from 2017 to 2020, when the Growth Research Index outperformed by 18.4 percentage points (23.8 percent versus 5.4 percent). Unfortunately, such long periods of underperformance led many investors to ignore the long-term evidence —from 1927 through 2021, the Fama-French Value Research Index outperformed the Fama-French Growth Research Index, 12.8 percent versus 10.2 percent. Note that while growth stocks are typically far more profitable than value stocks and they grow faster—which is why they deservedly command premium multiples — they have underperformed value stocks over the long term. The failure to consider that the price you pay for that faster growth (meaning the discount rate applied to future earnings) matters a great deal, along with the failure to consider the long-term historical return evidence, causes many to lose faith, believing the notion that “this time it’s different” and there’s a “new normal” in which innovative, disruptive growth companies will outperform value companies.
To help value investors keep the faith, we’ll review some important facts that show that the source of growth’s outperformance over 2012-2021 had very little to do with growth companies generating greater than already expected financial performance. We’ll begin by reviewing the findings from the 2021 study Reports of Value’s Death May Be Greatly Exaggerated. The authors found that virtually all the outperformance of growth stocks as far back as 2007 was due to a widening of the spread in P/E ratios between growth and value stocks. They also found that there was little difference in overall profitability of growth and value, as the average return on equity difference was almost the same before and after 2007 — there was no new normal or we would have seen a widening in profitability.
What’s important for investors to understand is that the widening of the spread (the P/Es of growth stocks increased dramatically relative to those of value stocks) does provide information as to future returns (the only kind you can buy). Research on the information value of the valuation spread, including the 2007 study Does Predicting the Value Premium Earn Abnormal Returns?, the 2018 study Value Timing: Risk and Return Across Asset Classes and the 2019 study Strategies Can Be Expensive Too! The Value Spread and Asset Allocation in Global Equity Markets, has found that the spread is positively correlated with the future value premium—the wider the spread, the larger the future value premium.
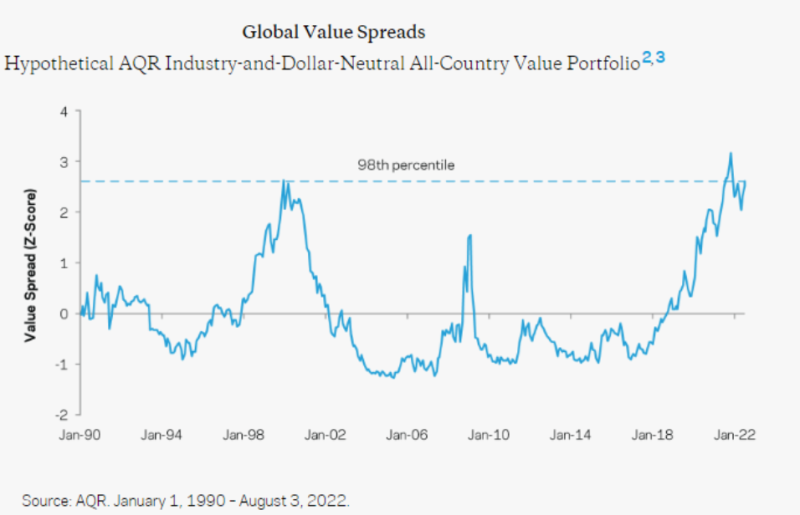
The good news for those patient value investors is that the outperformance of growth over the prior decade, which led to the valuation spread widening, pushed the spreads to historically high levels. Thanks to AQR Capital Management, we see that in August 2022, the spread was at the 98th percentile globally. Since the spread has been positively correlated with the future value premium, value investors should expect a higher than historical value premium going forward.
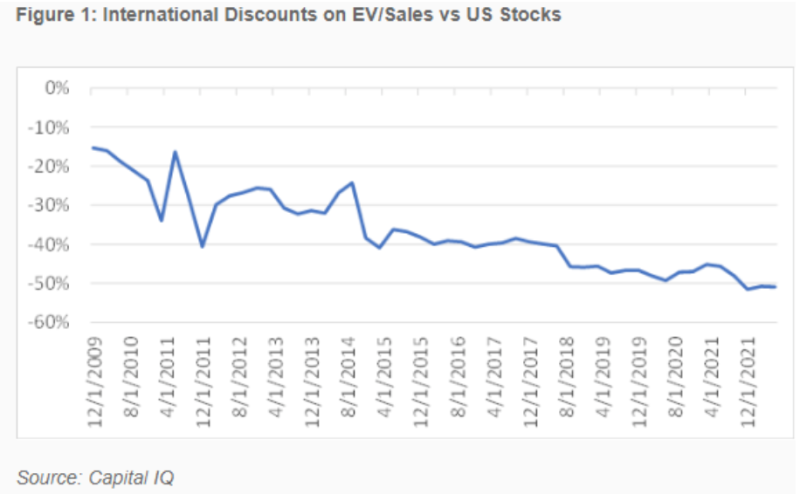
Thanks to the research team at Verdad, we can also examine other metrics that explain both value’s underperformance over the prior decade and why value investors should not lose patience. In the chart below, Verdad showed that over the past decade, international stocks went from trading at about a 15 percent discount to U.S. stocks based on enterprise value-to-sales to a 50 percent discount — international value companies were getting persistently cheaper relative to growth stocks.
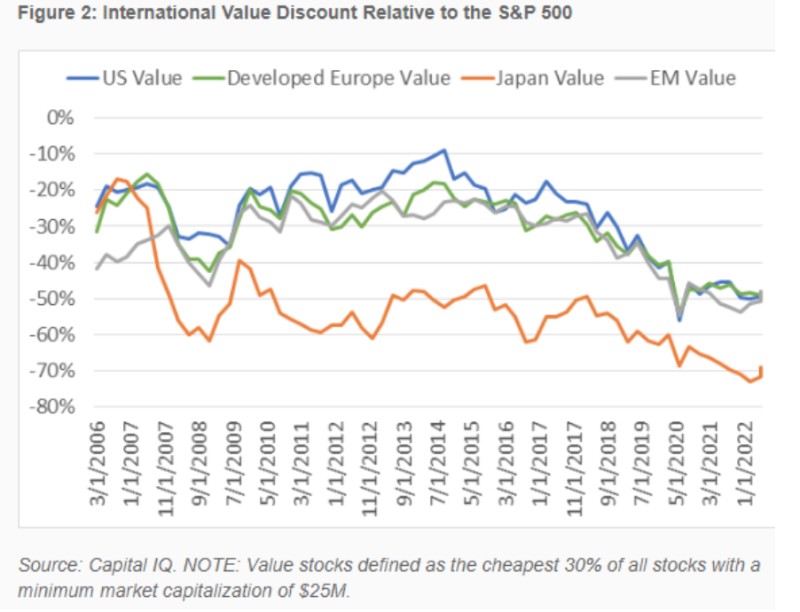
In the following chart, Verdad compared the enterprise value (EV)/EBITDA (earnings before interest, taxes, depreciation and amortisation) ratio for the cheapest 30 percent of stocks in each market to that of the S&P 500 Index. As you can see, value stocks globally “cheapened” by 20 percentage points or more over the past decade relative to the S&P 500. U.S., developed Europe, and emerging market value stocks are now trading at a 50 percent discount to the S&P 500, while Japan is trading at a 70 percent discount.
Was the widening of discounts justified?
It’s certainly possible that the widening spreads in valuations were justified by greater than expected financial performance of growth stocks relative to that of value stocks. However, as noted earlier, the authors of the study Reports of Value’s Death May Be Greatly Exaggerated found that while the difference in return on equity for growth stocks relative to value stocks had increased since 2007, the difference was minor and could not explain the difference in performance.
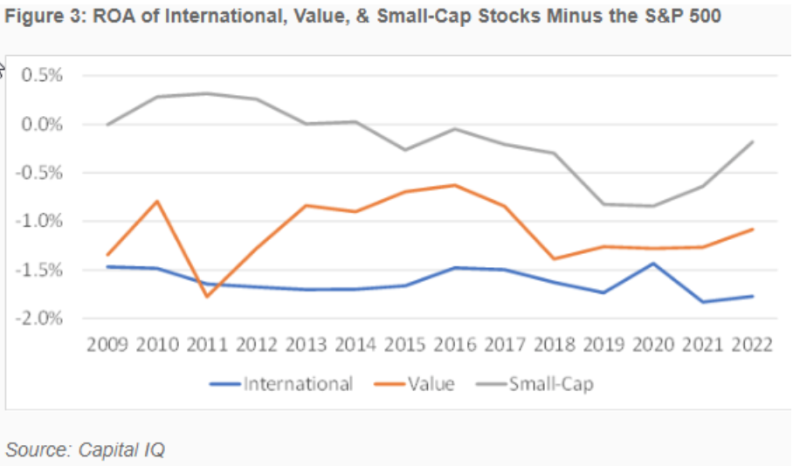
Verdad provided further evidence that greater than expected financial performance did not explain the lost decade for value stocks. In the following chart, Verdad showed the difference between the return on assets (ROAs) of the S&P 500 and international stocks (as measured by the S&P International 700), small-cap stocks (as measured by the S&P 600) and value stocks (as measured by the S&P 500 Pure Value) over the past 13 years. The chart shows that while international, value and small-cap stocks have lower ROAs on average than the broad U.S. market (explaining why the growth stocks have higher P/E ratios), the differences are small, and importantly, there was relatively little change over the period—the outperformance of U.S. growth stocks could not be explained by their greater than expected financial performance.
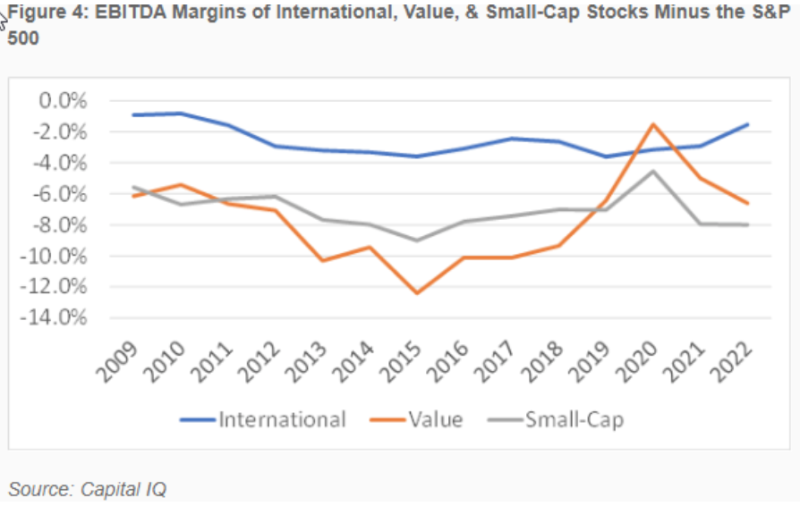
Verdad next turned to examining profit margins. The chart below shows the difference between the EBITDA margins of the S&P 500 and international stocks, small-cap stocks and value stocks (as measured by the same indexes as in Figure 3 above). As you can see, value stocks have lower margins than S&P 500 stocks, but those margin differences are relatively unchanged from a decade ago, albeit with high volatility for value stocks (the higher volatility helps explain why value stocks have lower valuations—they are riskier). Again, we see that the outperformance of growth stocks cannot be explained by financial performance that was greater than already anticipated (the EBITDA margins did not widen).
Has the tide already turned?
Signs of the end of the “new normal” in which growth stocks outperformed by wide margins began to appear in November 2020. From then through July 2022, the Fama-French U.S. Value Research Index outperformed the Fama-French U.S. Growth Research Index by 26.2 percentage points per annum (37.3 percent versus 11.1 percent).
Investor takeaways
The first takeaway is that investors should be careful when drawing conclusions based on differences in returns and make sure they understand the source of the outperformance. For example, stocks can underperform safe Treasury bills for a long time simply because the risks show up, causing the valuations of equities to fall as the risk premium demanded by investors rises. That greater risk premium should cause investors to expect higher future returns. And asset classes, like growth stocks, can outperform simply because of speculative demand, causing their relative valuations to rise as the discount rate applied to their expected future earnings falls. When that occurs, investors subject to recency bias expect that outperformance to continue. However, what they should expect is lower future returns because of the lower risk premium now demanded.
The second takeaway is that investors should be careful about drawing conclusions from relatively short data samples, and when it comes to risky assets, history suggests that 10 years of relative underperformance is likely to be nothing more than what economists call “noise,” a random outcome. If you doubt that, consider the three periods of at least 13 years over which the S&P 500 Index underperformed riskless one-month Treasury bills: 1929-43 (15 years), 1966-1982 (17 years) and 2000-12 (13 years). That is 45 of the last 93 years. Despite this, the S&P 500 Index outperformed one-month Treasury bills over the full period by 6.6 percent per annum, 9.9 percent versus 3.3 percent.
The third takeaway is that there was, and is, no new normal for growth stocks. In fact, we have “been there and done that” during the late 1990s (the dot-com era) when growth stocks outperformed because their relative valuations rose. And similar, though smaller, drawdowns for value stocks occurred during the biotech boom from 1989-1991 and the during the “Nifty Fifty” era (1969-1971). The widening of the valuation spread should have led investors to expect value to outperform by more than it had historically. And that is exactly what happened in each case. For example, the dot-com era was followed by the largest outperformance of value stocks relative to growth stocks in history. Over the eight-year period 2000-2007, the Fama-French U.S. Value Research Index returned 11.0 percent per annum, outperforming the Fama-French U.S. Growth Research Index return of just 0.4 percent per annum by 10.6 percentage points a year. As you saw in the chart on valuation spreads from AQR, today’s valuation spreads are very similar to what they were at the last peak in the “bubble” in growth stocks. While that isn’t a guarantee that value stocks will outperform, and do so by significant margins, it’s what the historical evidence suggests is likely.
If you are among the many investors considering losing your patience with value investing in favour of putting all their money in the S&P 500 or a total market fund, consider that valuation gaps that have driven wide relative return differences have historically been strongly mean reverting. The knowledge of financial history can help prevent investors from falling prey to stories of new eras and new normals and becoming victims of recency bias.
The information presented herein is for educational purposes only and should not be construed as specific investment, accounting, legal or tax advice. Certain information may be based on third party data which may become outdated or otherwise superseded without notice. Third party information is deemed to be reliable, but its accuracy and completeness cannot be guaranteed. By clicking on any of the links above, you acknowledge that they are solely for your convenience, and do not necessarily imply any affiliations, sponsorships, endorsements or representations whatsoever by us regarding third-party Web sites. We are not responsible for the content, availability or privacy policies of these sites, and shall not be responsible or liable for any information, opinions, advice, products or services available on or through them. The opinions expressed by featured authors are their own and may not accurately reflect those of the Buckingham Strategic Wealth® or Buckingham Strategic Partners® (collectively Buckingham Wealth Partners). LSR-22-379
LARRY SWEDROE is Chief Research Officer at Buckingham Strategic Wealth and the author of numerous books on investing.
ALSO BY LARRY SWEDROE
New study highlights 20 years of failure for active managers
Identifying winning funds ex ante: Is it possible?
The impact of uncertainty on investor behaviour
Is democracy good for stock market returns?
How have hedged mutual funds performed since the GFC?
FIND AN ADVISER
Investors are far more likely to achieve their goals if they use a financial adviser. But really good advisers with an evidence-based investment philosophy are sadly in the minority.
If you would like us to put you in touch with one in your area, just click here and send us your email address, and we’ll see if we can help.
Picture: Amirali Mirhashemian via Unsplash
© The Evidence-Based Investor MMXXII


