By LARRY SWEDROE
When developing a retirement plan, most individuals are well aware of the issue of longevity risk — living longer than expected, increasing the risk of not having sufficient assets to sustain a desired standard of living. However, there is another lesser-known threat that can derail an otherwise well-thought-out retirement plan. That threat is known as “sequence risk” — the order of returns matters.
Equity investors must consider that market volatility calls into question the viability of using risky assets to generate stable periodic cash flows throughout a long-term horizon. The reason is that, although long-term expected returns from stocks may be attractive, a sequence of negative returns can deplete a retirement income portfolio to the point where it lacks sufficient dollars to recover — the sequence of returns matters. Consider the following example from Your Complete Guide to a Successful and Secure Retirement.
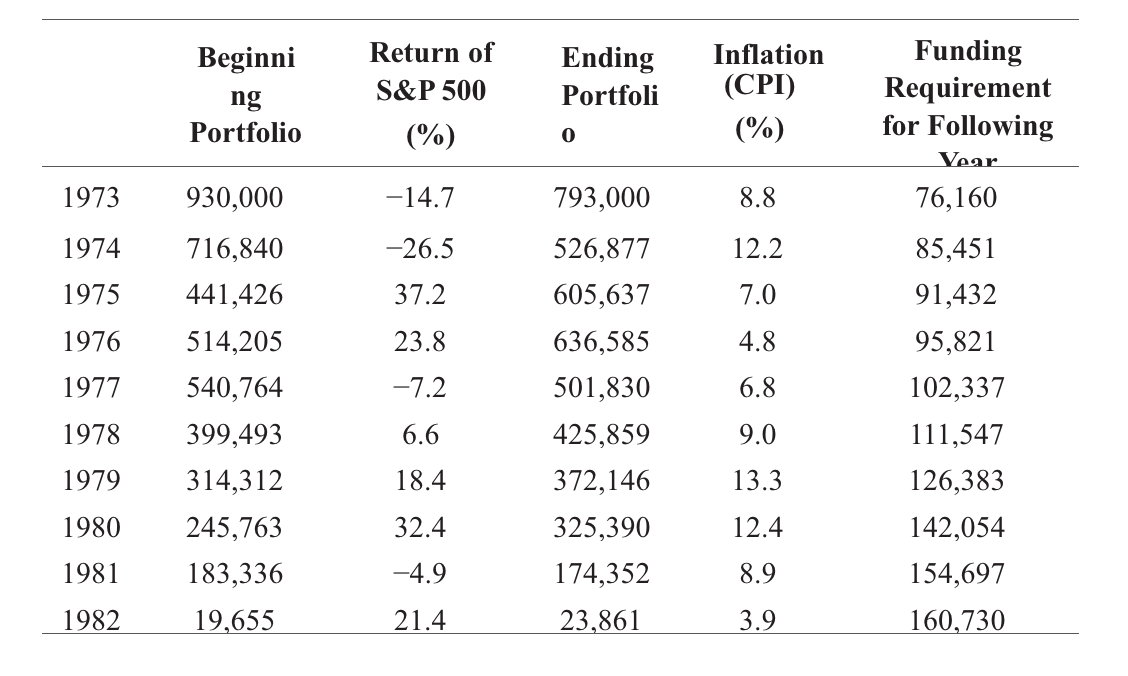
It’s January 1973, and your crystal ball allows you to foresee with certainty that over the next 27 years (1973-99) the S&P 500 Index would return 13.9 percent per year and inflation would rise 5.2 percent a year. Thus, the real return for an investor in the S&P 500 Index would be 8.7 percent per annum. With that certainty, you assume you can safely withdraw an inflation-adjusted 7 percent (1.7 percent per year below the actual realised return) of your original principal every year and not worry about running out of assets. How did that turn out?
The threat of sequence risk
As you can see in the table below, despite providing an 8.7 percent per annum real return over the 27-year period, because the S&P 500 Index declined by approximately 40 percent in the 1973-74 bear market, withdrawing just an inflation-adjusted 7 percent per annum in the portfolio caused it to be depleted by the end of 1982 — in just ten years!
As you can see, in the decumulation phase the order of returns matters a great deal. The reason is that systematic withdrawals work like a dollar-cost averaging program in reverse, and market declines are accentuated. This can cause principal loss from which the portfolio may never recover. As the table below demonstrates, the combination of the bear market and relatively high inflation caused the portfolio to shrink by almost 57 percent in the first two years. In order for the portfolio to be restored to its original $1 million level, the S&P Index would have had to return 127 percent in 1975. And because of the inflation experienced, the amount needed to be withdrawn had increased from $70,000 to over $90,000. In cases such as this, if adjustments are not made to the plan (such as increasing savings, delaying retirement or reducing the spending goal), the odds of outliving your assets greatly increase.
Since 1975, we have had two similar drops in market values — during the 2000 through 2002 bear market and during the Great Financial Crisis that began in 2007. Clearly, such risks should be incorporated into a withdrawal strategy.
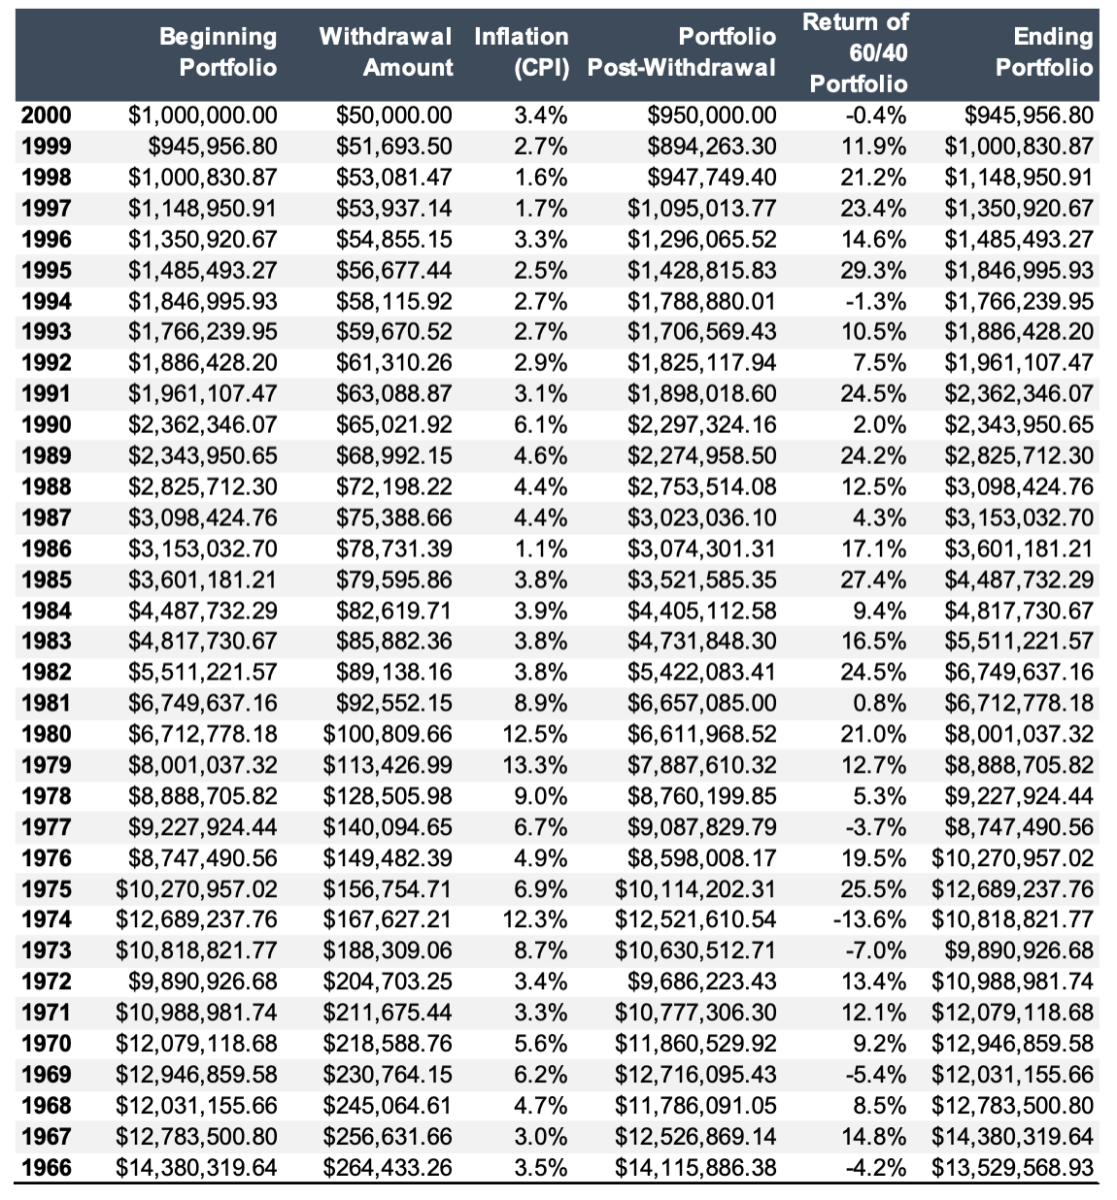
Historically, a safe harbour withdrawal rate for a 65-year-old couple has only been about four percent of the portfolio’s initial value (with the withdrawal adjusted each year for inflation to maintain a real level of spending). With that in mind, we will examine how a four percent withdrawal rate would have performed for someone who retired with a $1 million portfolio at the end of 1965. The portfolio is 60 percent S&P 500 Index and 40 percent five-year Treasuries, rebalanced annually. Note that the example assumes no taxes nor any investment expenses.
Has the four percent rule been “safe”?
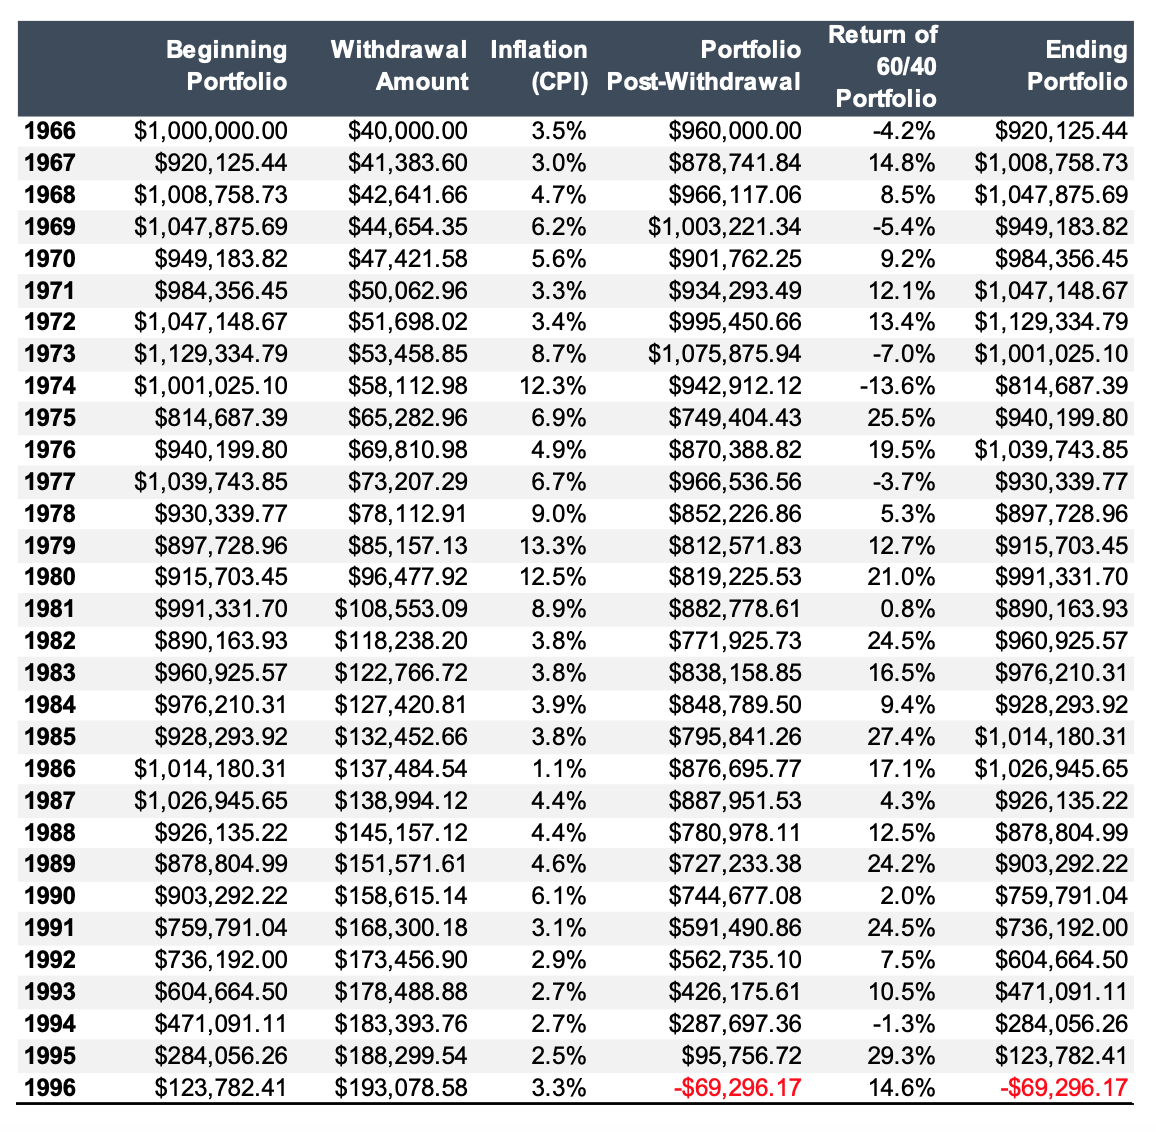
As you can see, if no adjustments were made to the four percent withdrawal rate, the portfolio would have lasted 30 years, being depleted in 1996. Before you conclude that this demonstrates that the four percent withdrawal rate is safe (without risk), there are three important observations we need to make note of. The first is that today the odds that a 65-year couple will have at least one spouse live to age 95 is almost 20 percent. And life expectancy at age 65 in OECD countries is expected to grow by 4.2 years for women and 4.6 years for men between 2020 and 2065. Being alive without assets is not a pleasant thought.
The second is that the example begins in 1966 with the Shiller CAPE 10 at about 24 (below today’s level of about 30 even after adjusting for changes in accounting rules and lower dividend payout ratios), the 10-year Treasury yield at about 4.6 percent (well above today’s levels), and inflation at just 1.9 percent. With equities at higher valuations and bonds at lower yields, a four percent withdrawal rate does not look quite as safe today as life expectancy continues to increase — at least for those who are unable or unwilling to make adjustments to their spending. And the third, as mentioned earlier, is that the example assumes no taxes and no investment expenses. Fortunately, today investment expenses are approaching zero, at least for index-type investors. But taxes are not zero and must be considered.
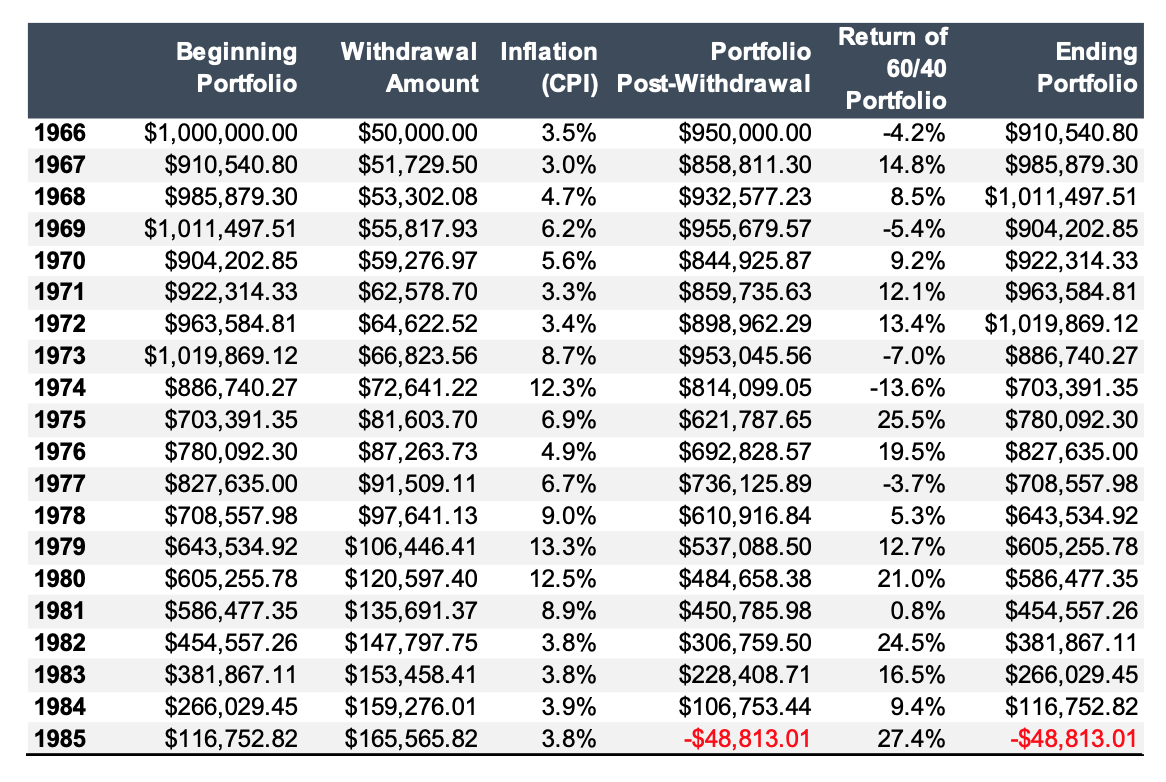
We can also examine the results for a 5 percent withdrawal rate to see how successful that was. As you can see in the table below, it would have failed in 1985. Clearly, 5 percent has not been safe, at least for those unable or unwilling to make adjustments to spending.
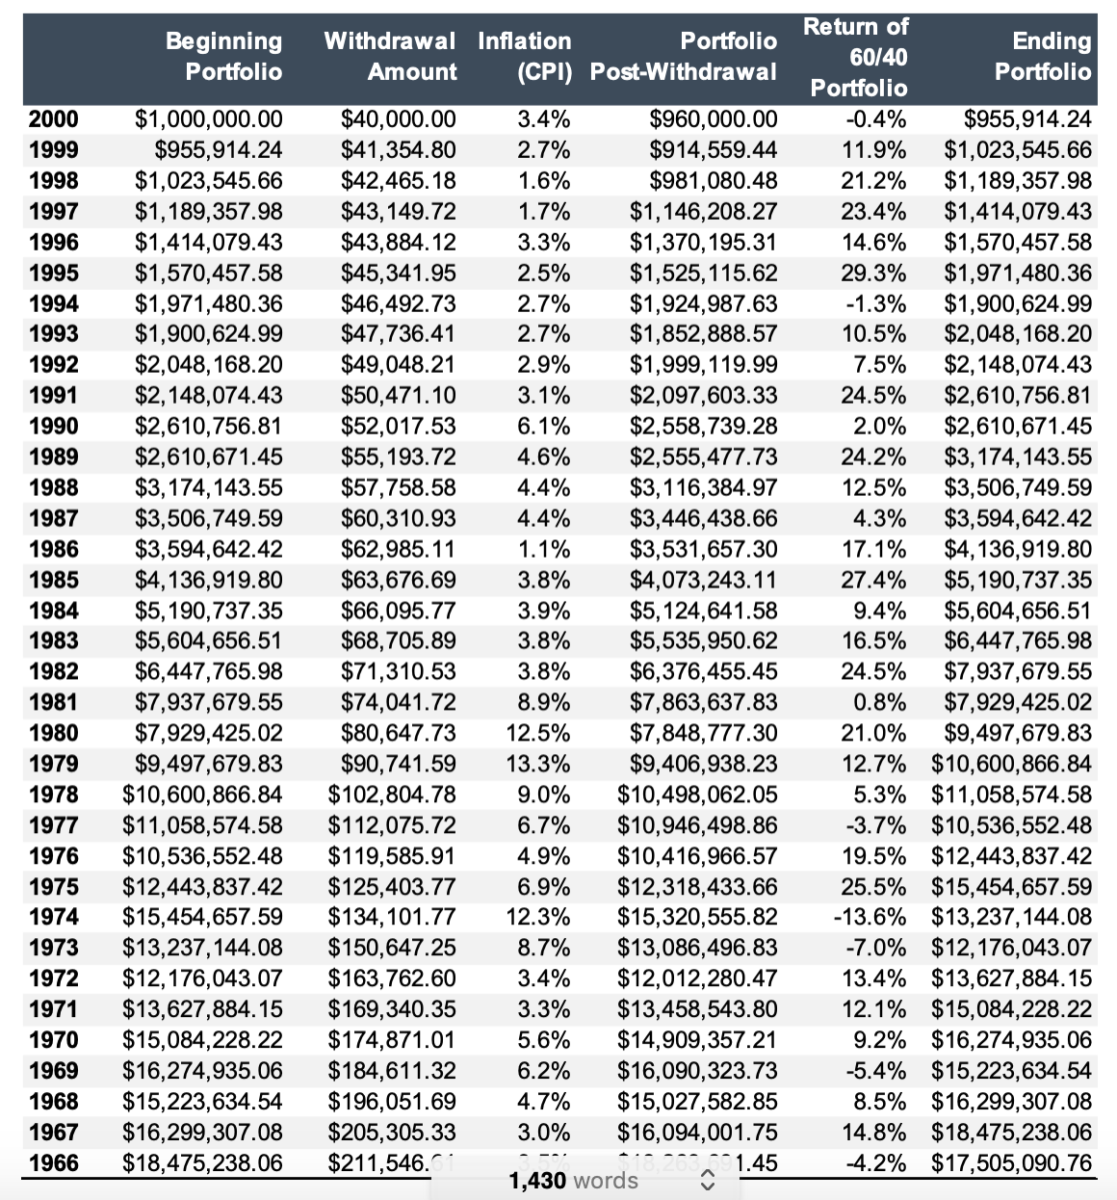
Our final example demonstrates the role that luck can play in whether a retirement strategy is successful. Using the same four percent withdrawal rate, we will examine the same period beginning in 1966. However, we will reverse the order of returns and start with returns from the year 2000, to allow for an even longer 35-year period.
The role of luck
Using 2000 as our starting point, as you can see in the table below, if the returns were earned in the reverse order, instead of depleting after 30 years, the portfolio would have increased to more than $17.5 million!! We can also examine how the more aggressive 5 percent withdrawal rate, which had failed in the 20th year, would have performed. As you can see, the portfolio reached its nadir after two years, falling just below $900,000. However, by the end of 30 years it would have grown to more than $13.5 million.
Summary
Addressing the issue of sequence risk is an important part of developing a retirement plan that provides you with the greatest odds of achieving your life and financial goals. You don’t want to rely on luck. And you don’t want to rely on historical returns because today’s bond yields are at much lower levels and future equity returns are lower as valuations are higher. Successful outcomes are more likely to be the result of having a well-thought-out plan, one that considers “alternative universes” that could play out.
Since we live in a world with cloudy crystal balls, with future investment returns unknown, the best we can do is estimate. Thus, it is best not to treat a portfolio’s estimated return as a certain return. Instead, one should consider the possible dispersion of likely returns and then estimate the odds of achieving your financial goals (the primary one being not outliving your assets). The task is best accomplished through the use of a Monte Carlo simulator (MCS) — a computer simulation with a built-in random process. Typically, the program will produce thousands of random iterations, letting one see the estimated odds of meeting a goal. Those who have more options they can exercise if sequence risk rears its ugly head and the early investment returns are poor can be more aggressive in accepting higher estimated odds of failure. On the other hand, those with no acceptable options should seek odds as close to 100 percent as possible, as being wrong (running out of assets) is unthinkable for most people. The MCS can not only help you choose the optimal withdrawal rate but also help you decide on the most appropriate asset allocation.
LARRY SWEDROE is Chief Research Officer at Buckingham Strategic Wealth and the author of 17 books on investing, including Think, Act, and Invest Like Warren Buffett.
Larry is a regular contributor to TEBI. Here are some of his other recent articles:
The faces on active share and outperformance
How interest rates affect risk taking
Do yield curve inversions tell us anything useful?
Talk of a passive bubble is just hot air
Are IPO stocks worth the risk?