Vanguard and Dimensional Fund Advisors are both good fund managers — albeit with two very different methodologies. Investors should be able to achieve good outcomes with either one or the other, or a combination of the two. But which of them, Vanguard or Dimensional, delivers higher returns, on a cost- and risk-adjusted basis, over the long term?
MARK HEBNER and MURRAY COLEMAN from Index Fund Advisors in California have crunched the numbers — and their analysis shows there is a very clear winner.
As advocates for passive investing, a common question by clients and prospects we hear is why our 100 IFA Index Portfolios utilise strategies from Dimensional Fund Advisors versus better-known passive fund companies such as Vanguard or iShares.
The answer is quite simple. It comes down to risk-adjusted performance.

For example, if we were to compare the performance of 20 IFA Index Portfolios utilising strategies from Dimensional versus that of Vanguard, we see a consistent trend of outperformance across almost all risk levels. We have written before about why Dimensional is our preferred fund partner here and here.
So let’s take a deep dive into why (and how) Dimensional was able to provide results that’ve stood out to our investment committee, both in terms of execution and design.
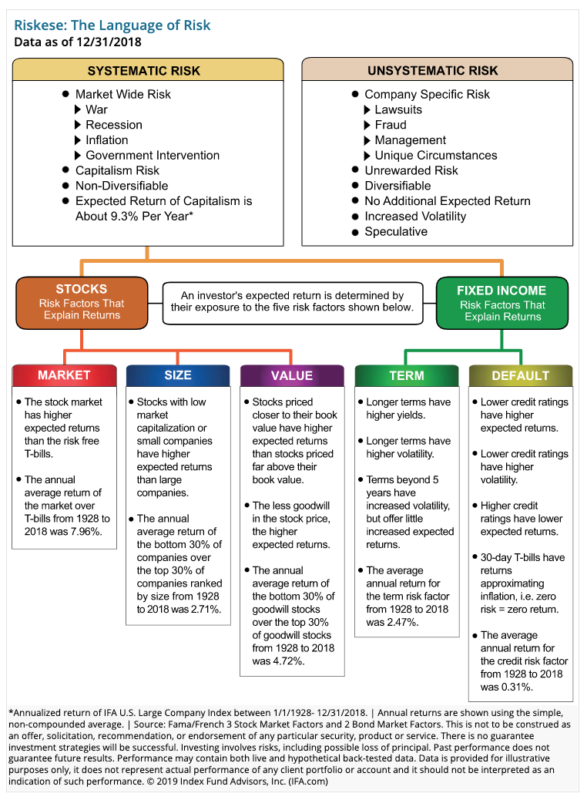
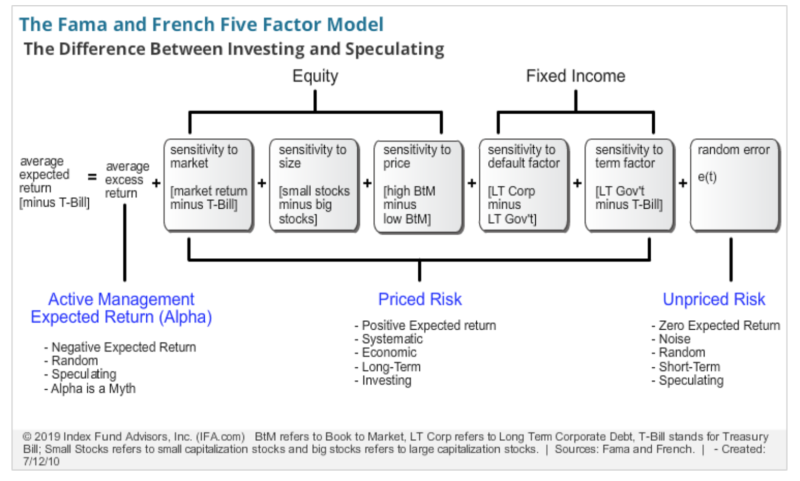
First, let’s review the Fama/French 3 Factor Model, which was introduced in 1992 in their groundbreaking research paper, “The Cross-Section of Expected Returns.”
Examining U.S. equity returns from 1962 to 1989, professors Eugene Fama and Kenneth French found three key factors that explained much of the variation in historical stock returns. They were the market, size and relative-price (value) factors. Their findings led to a revolution in the index fund industry as new index funds built around small-cap stocks emerged, which up to that time was dominated by funds tracking the S&P 500.
From an investment advisory standpoint, guiding investors to build globally diversified portfolios of index funds structured around these factors have only yielded better results over the long-term. For the extended period since the original publication of the Fama/French research paper (1993 through 2018), the return of IFA Index Portfolio 100 has yielded a 0.21% per year premium, net of advisory fees, over the S&P 500 (9.32% vs. 9.11%). In terms of the growth of wealth, $100,000 invested in IFA Index Portfolio 100 ended up with $48,706 more than just simply investing in the S&P 500.
When we examine which types of funds we would like to include in our portfolios, we want to be able to gain a general understanding of how much exposure each fund has towards these three factors. We are able to do this through the use of multiple regression analysis.
A multiple regression measures correlations between a dependent variable and multiple independent variables. The question we are asking is, “how well do the independent variables explain the variation of the dependent variable?” To give a practical example, if we were looking at the Vanguard Value Index Fund, we want to know how much of the variation of the fund is explained by the market, size and relative-price factors — independently. The diagram below illustrates a multiple regression using the Fama/French Three Factor Model.
If we can gain an understanding of how much a fund is exposed to these various factors, then we can start to make statements about future performance. For example, let’s compare the performance of the Vanguard Value Index Fund (VIVAX) versus the DFA U.S. Large Value Strategy (DFLVX) from 10/1/1999 to 12/31/2018 (the longest period where performance for both is available).
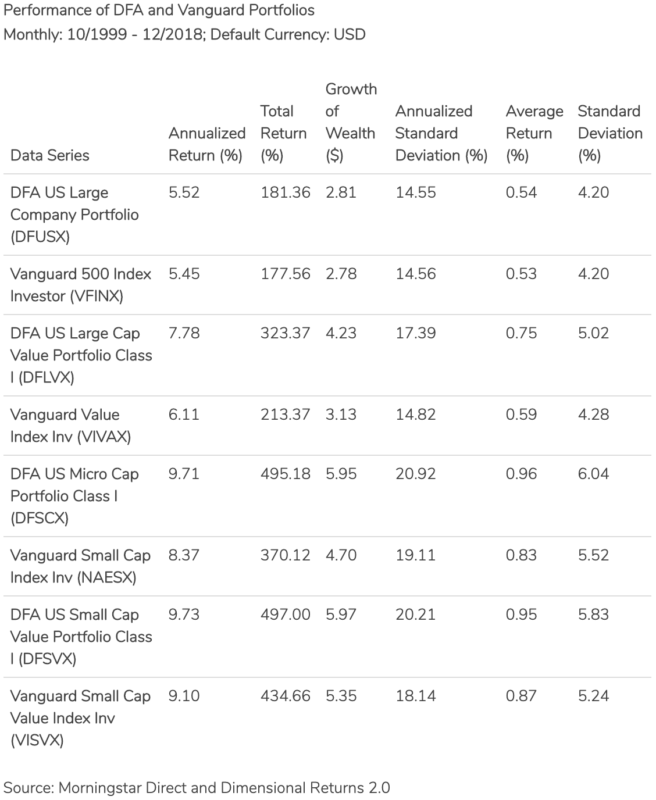
As you can see, DFLVX outperformed VIVAX by 1.67% per year. Aren’t they both indexing value stocks? Yes they are, but not all indexes are created equal and the ability for a fund management company to capture premiums in the market is no easy task. In other words, there is very little argument about whether or not these premiums exist. How a fund company goes about capturing them is a completely different story. You will also see that Dimensional outperforms Vanguard across the U.S. Small Cap and U.S. Small Cap Value asset classes as well.
But we already know that the driving factor behind DFLVX’s outperformance must be coming from their ability to have an exposure that is more sensitive to the market, size, and relative price premiums. This can be seen in the individual regressions for DFLVX and VIVAX.
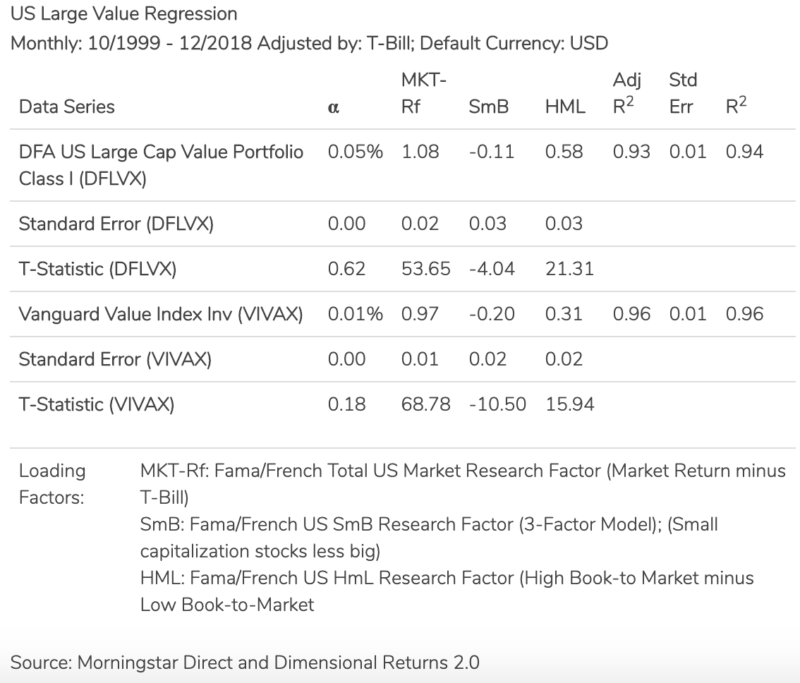
Let’s first explain the variables.
- Alpha (α): the excess return of the fund compared to its risk-adjusted (β) benchmark
- MKT-Rf: measures the fund’s sensitivity to the market factor. A numerical value greater than 1 indicates the fund is more volatile than the overall market and vice versa
- SmB: measures the fund’s sensitivity to the size factor. A positive number indicates an overall exposure that tilts towards small-cap stocks while a negative number indicates a tilt towards large-cap stocks
- HML: measured the fund’s sensitivity to the relative-price (value) factor. A positive number indicates an overall exposure that tilts towards value stocks while a negative number indicates a tilt towards growth stocks.
- Adjusted R2: measures how well the overall model explains the variation of the fund, adjusting for the amount of independent variables. You can read the number as a percent
- T-Statistic: indicates the level of statistical significance of the estimate in the model. A level of 2 or greater indicates a high level (95%) of statistical significance, making the estimates highly reliable.
First thing you should notice is that neither fund has a statistically significant alpha, which is what we would expect in a properly functioning market. Second thing to notice is the adjusted R-squared for each is over 90% meaning that the overall model explains the vast majority of the historical performance of each fund, which indicates that the model can be seen as highly reliable.
Lastly, if we look at the individual risk factors, we see that DFLVX has greater exposure to the market, size, and relative-price factors meaning that the overall portfolio is slightly smaller in terms of market capitalization and has a greater tilt towards value stocks compared to that of VIVAX. All of these estimates are highly reliable (t-stat>2). Since we know a greater exposure to these factors is likely to yield greater performance, we can now understand why DFA has provided superior returns.
We can use the same analysis when comparing DFA and Vanguard in the U.S. Small-Cap and U.S. Small Cap Value segments of the market.
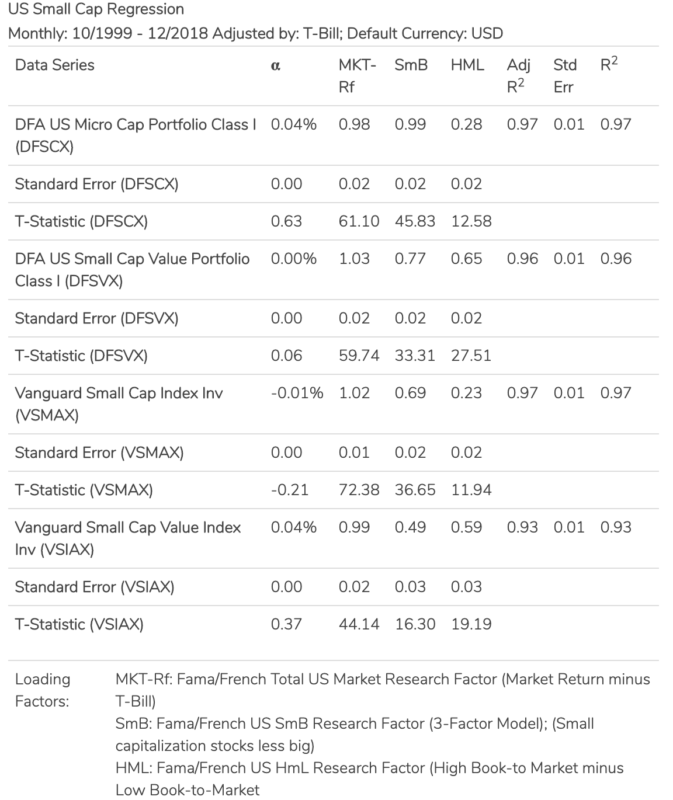
It’s important to note that this outperformance is not free. As we would expect in a properly functioning capital market, a higher return must be associated with higher risk. If we plot each strategy in terms of standard deviation, we can see that there are higher levels associated with the strategies from DFA.
What this means for investors is that we should expect to see more variability in the returns of the DFA strategies, emphasising the importance of taking a disciplined approach to investing when you are pursuing risk premiums. We believe the help of an independent wealth advisor assists in maintaining that discipline and capturing the overall benefits the capital markets provide the long-term investor.
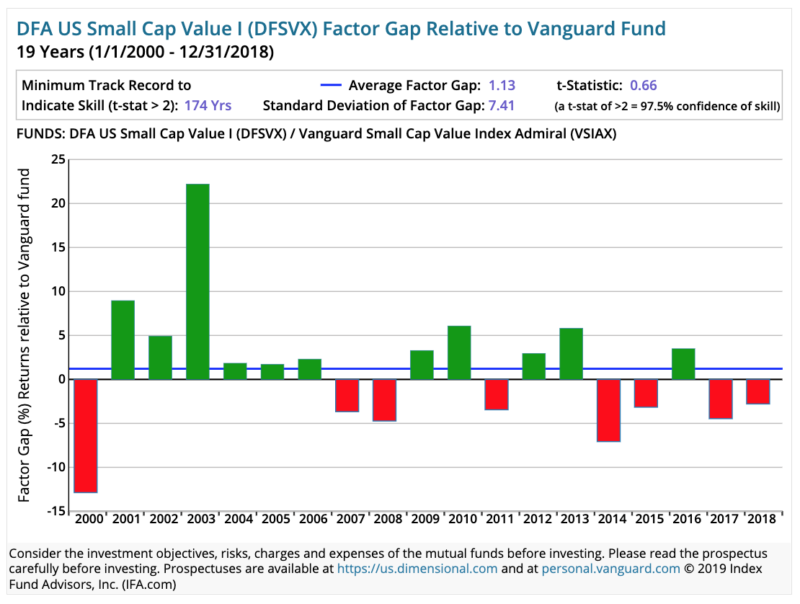
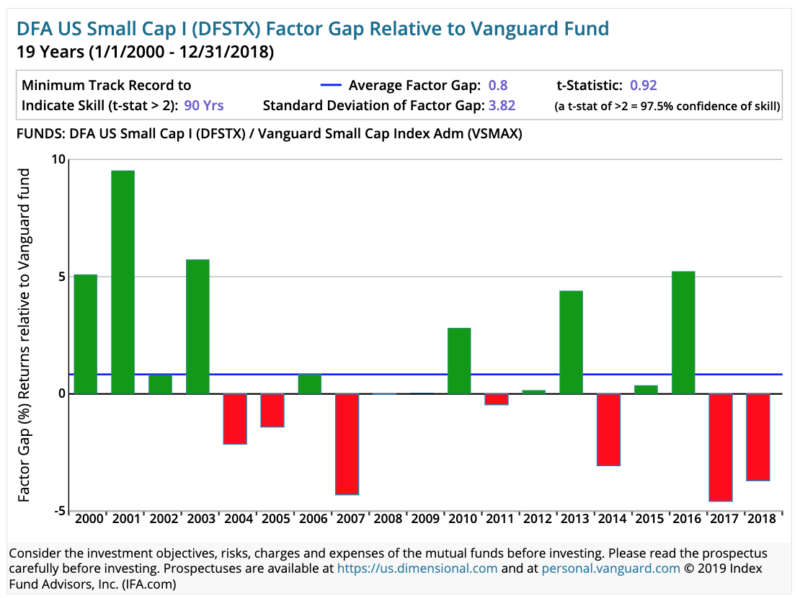
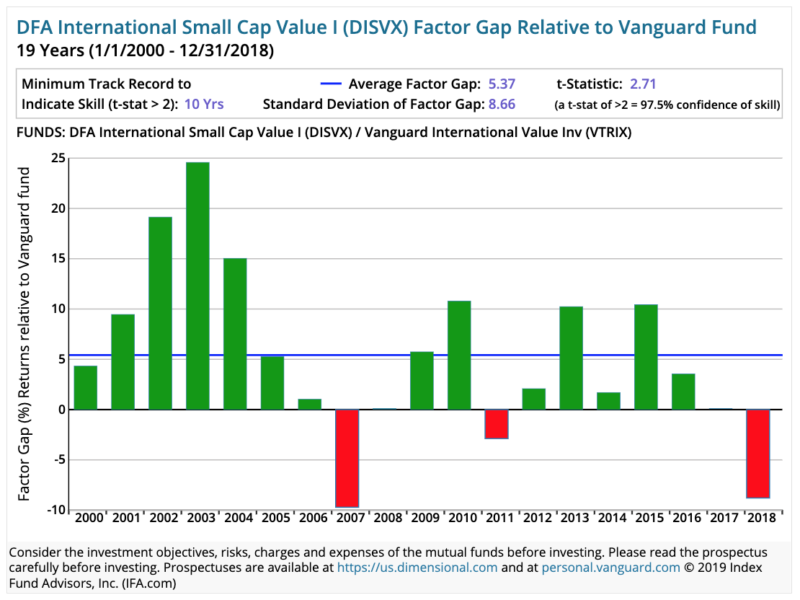
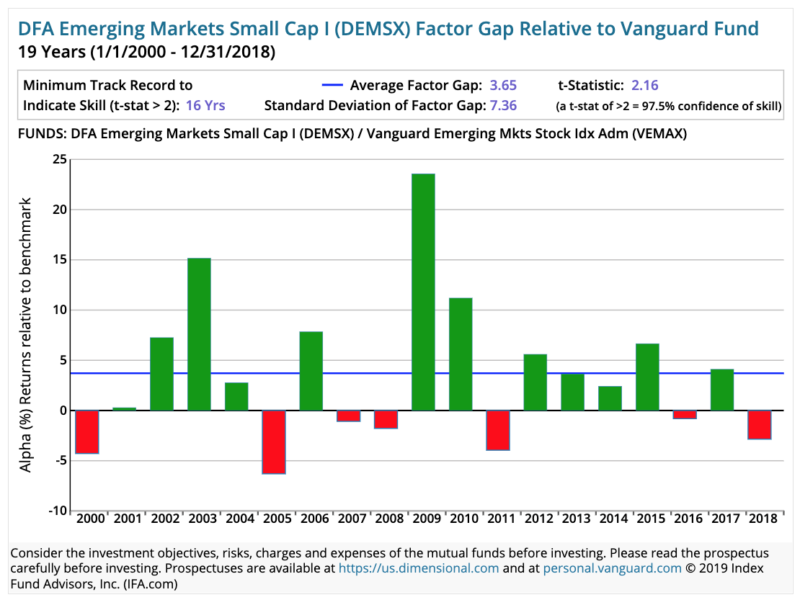
So now let us look at the year by year Factor Gaps (different exposures to the dimensions of returns) of Dimensional passive funds recommended by IFA versus the closest Vanguard alternative passive fund, which we refer to as the “BENCHMARK” in the following charts.
The green bars illustrate years when Dimensional’s factor tilts and implementation strategies had higher returns than the Vanguard alternative and the red bars illustrate when Vanguard Funds had higher returns with standard indexes. Generally speaking, Vanguard indexes have lower tilts to small and value factors. A t-stat of 2 or greater indicates statistical significance of the factor gap difference. All comparisons, except a 0.01% difference on the S&P 500 fund in favor of Vanguard, showed higher average returns in Dimensional Funds and four of the 10 reviewed showed statistical significance. For the calculation of t-stats and very long term factor premium charts, see this article.


As a fiduciary, it is our responsibility to provide guidance rooted in doing right by our clients and backed up by empirical research. Although Vanguard is more known in the passive investment community, we understand that Dimensional has better captured the premiums that have been shown to reward investors over the long-term. We have structured our portfolios around these premiums in a diversified manner so that they can get the most that the capital markets provide.

This is not to be construed as an offer, solicitation, recommendation, or endorsement of any particular security, product or service. There are no guarantee investment strategies will be successful. Investing involves risks, including possible loss of principal. IFA Index Portfolios are recommended based on an investor’s risk capacity, which considers their time horizon, attitude towards risk, net worth, income, and investment knowledge. Take the IFA Risk Capacity Survey to determine which index portfolio matches your risk capacity. For detailed information on the hypothetical back-tested performance data shown in this article, including sources, updates and important disclosures, see https://www.ifabt.com Consider the investment objectives, risks, charges and expenses of the mutual funds carefully before investing. Please read the prospectus carefully before investing. IFA utilises “standard deviation” as a quantification of risk, see the definition of “standard deviation” in the IFA Glossary.
Index Fund Advisors is a strategic partner of The Evidence-Based Investor in the United States. You’ll find a wealth of information about evidence-based investing on its website and YouTube channel, including the award-winning documentary, Index Funds: The 12-Step Recovery Program for Active Investors, presented by TEBI’s Robin Powell.
Picture: Hermes Rivera via Unsplash