
We’ve written many times about so-called closet index funds. These are funds that describe and market themselves as actively managed — and charge accordingly — but effectively hug the index. You don’t need a PhD in finance to work out that closet trackers are a thoroughly bad deal for consumers. After costs they’re near enough guaranteed to lag the market. But what about the opposite of a closet index fund — in other words, a fund whose portfolio looks nothing like the index? Such funds are said to have high active share. The more a fund diverges from the index, the greater its active-share score.
For many years, high active share was seen as a panacea for active management’s ills; the way to outperform, investors were told, was to find a high-conviction, contrarian fund manager.
Surprise, surprise: it turns out not to be anything like that simple. New research from Morningstar shows that active share is, in fact, a very poor predictor of future performance, as JOHN REKENTHALER explains.
Eureka!
In 2006, two Yale business school professors, Martijn Cremers and Antti Petajisto, introduced a statistic called “active share” in How Active Is Your Fund Manager? A New Measure That Predicts Performance. The authors’ active-share measure compared an equity fund’s portfolio with that of a relevant index. The more that a portfolio diverged from the index, the greater its active-share score. The greater the active-share score, the more actively the fund was deemed to be managed.
Upon hearing the news, I was envious. The active-share statistic is unquestionably handy, being a single number that differentiates between funds that invest like an index and those that do not. In addition, it is conceptually straightforward. (Even I understand the math.) Morningstar should have invented that measure! Well, at least I knew who to blame — the company’s research director.
No worries; not everything needs to be invented here. In due time, Morningstar added active share to its coverage. The statistic appears on the Portfolio tab of morningstar.com’s mutual fund reports. For example, idiosyncratic Fairholme Fund (FAIRX) carries an active share of 99%, while mammoth Fidelity Contrafund (FCNTX) scores only 48%. Quite the difference!
A bridge too far
So far, so good. Unlike Morningstar’s former research director, active share does its job admirably. Unfortunately, the authors didn’t present the tool and leave the matter at that. They took the much bolder step of claiming that active share conveys merit. Funds with higher active-share scores, they reported, had outgained those with lower scores. They then promised, as their paper’s headline states, that active share “predicts performance”.
The mutual fund industry was delighted. Its product managers published article after article after article about the benefits of being different — that is, about why potential customers should consider buying higher-cost funds that were actively managed rather than index their investments. There were even presentations that instructed marketers how to use active share’s findings in their materials.
However, there was a hidden problem with the argument that high active share meant stronger future performance: the small-company effect.
Virtually by definition, active-share scores are higher for funds that invest in widely dispersed investment universes, populated by many stocks with small weightings, than they are for concentrated universes that are dominated by their top holdings. In practice this means that funds that invest in large companies consistently receive lower active-share scores than do their mid- and small-cap rivals. For example, the average stock market capitalisation of Fidelity Contrafund’s holdings is $315 billion, while that of Fairholme Fund is only $3 billion.
Hot off the press
In his recent white paper, Unattractive Share, Morningstar’s Robby Greengold demonstrates the link between active share and index concentration. (Do read the paper; it provides much of the background for this column.) The chart below shows his work, plotting 1) the median active-share score for all actively run funds in each of the nine U.S. diversified equity fund categories against 2) the percentage of assets commanded by the relevant benchmark’s top 10 holdings.
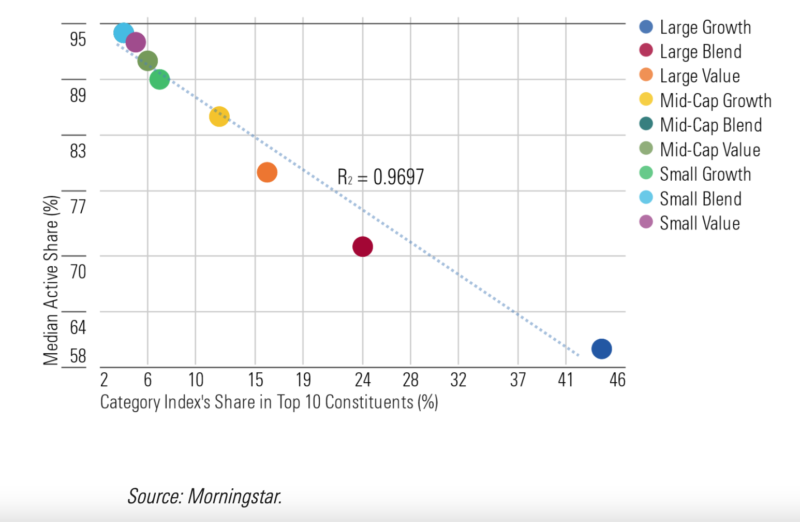
Because active share indirectly captures small-company stock ownership, the statistic’s predictive power depends upon such companies’ performances. When secondary stocks lead the way, the measure tends to thrive, and vice versa. To be sure, the authors perceived this relationship and attempted to correct for the effect in their work. Unfortunately, they did not fully succeed at that task. This is not only my conclusion but also that of several Fidelity researchers.
The lost decade
Perhaps inevitably — after all, the “value-stock premium” that Ken French and Eugene Fama so famously identified promptly disappeared following their paper’s 1993 publication — small-company stocks have languished since the active-share statistic began to make the headlines. For the decade from 2011 through 2020, Vanguard 500 Index (VFIAX) outgained Vanguard Small Cap Index (VSMAX) by almost 2 percentage points per year.
Unsurprisingly, at least to me and to Fidelity’s research squad, funds with high active-share scores have struggled. Once again, Mr Greengold supplies the evidence. The following chart depicts the average relative return for high-active-share and low-active-share funds. Once again, the groups consist of all actively managed funds within each of the nine U.S. diversified equity categories, from 2011 through 2020. The returns are gross, meaning (unlike actual fund results) they do not include the drag of expenses. The comparisons are against each category’s benchmark.
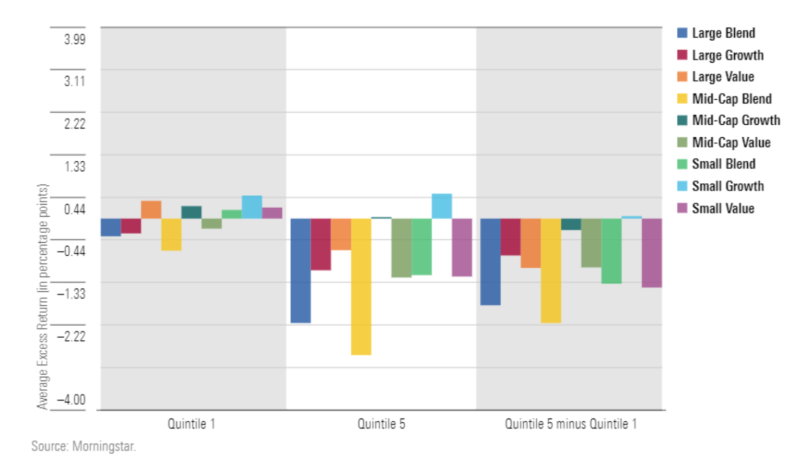
You might think that Quintile 1 contains the highest-active-share funds, while Quintile 5 holds the lowest-scoring funds. If so, investing in funds with high active-share scores would not have been a particularly successful strategy, given that Quintile 1 funds roughly matched the indexes before paying their costs. But they certainly beat the alternative. Regrettably, though, the quintile rankings are reversed. Quintile 1 consists of the least-active funds, and Quintile 5 the most.
The off-screen news is worse yet. On average, the higher the active share, 1) the larger a fund’s expense ratio, 2) the greater its risk, and 3) the lower its tax efficiency. Compare Quintile 1 against Quintile 5 not on gross returns, but instead by risk- and tax-adjusted net returns, which reflect the actual experiences of investors who hold them in taxable accounts, and the contest becomes a rout.
In summary
It’s one thing to describe funds. Many statistics do that. Investment categories create buckets that contain funds that invest in reasonably similar fashion; asset mixes convey a fund’s stock and bond market allocations; and country weightings indicate a fund’s geographic exposures. Such items have a modest goal: to help investors understand their portfolios’ risks, as well as their potential rewards.
It’s quite another thing to prescribe funds by claiming to have uncovered a calculation that can identify future winners and losers. That goal is far more difficult to achieve. The active-share score excels at description; it neatly distinguishes between funds that hug their benchmarks and those that do not. Beyond that, one should not ask.
JOHN REKENTHALER is a columnist for Morningstar.com and a member of Morningstar’s investment research department. This article was first published on the Morningstar blog.
MORE FROM MORNINGSTAR
What should investors for in an index?
Active managers failed their Covid test
Thematic funds: good stories, poor investments
Picture: Mike van Schoonderwalt via Pexels
© The Evidence-Based Investor MMXXI
Robin is a journalist and campaigner for positive change in global investing. He runs Regis Media, a niche provider of content marketing for financial advice firms with an evidence-based investment philosophy. He also works as a consultant to other disruptive firms in the investing sector.


