
This is a guest post from DIMENSIONAL FUND ADVISORS
For nearly 40 years, research at Dimensional has focused on advancing the understanding of what drives differences in expected returns among securities. Recent research into the behaviour of stocks with high investment, as measured by asset growth, suggests new ways to potentially enhance expected returns for stock investors.
The theory
Valuation theory provides a framework for analysing the drivers of expected returns. It says that a stock’s price reflects expected future cash flows to shareholders discounted to the present through an expected rate of return. Valuation theory therefore predicts that for a given level of expected future cash flows, the lower the stock price, the higher the expected return on the stock. Similarly, for a given stock price, the higher the expected future cash flows to shareholders, the higher the expected rate of return. Expected future cash flows to shareholders are related to the expected future profits of the company. However, not all profits are returned to shareholders because companies may make investments. Therefore, expected investment lowers expected future cash flows to shareholders, holding expected future profits constant. Simply put, a company that must invest heavily to sustain its profits should have lower cash flows to investors than a company with similar profits but lower investment. If both companies trade at the same price today, this implies that the company with higher investment and lower cash flows has a lower expected return.
The data
How can we measure and quantify firm investment? There are three ways a firm can raise capital to invest: equity issuance, debt issuance, and growth in retained earnings. Asset growth aggregates financing from all three methods. Equity issuance and growth in retained earnings both lead to an increase in the book equity of a firm and, as a result, to an increase in total assets. Debt issuance leads to an increase in the liabilities of a firm and consequently also to an increase in its total assets. Thus, we can focus on asset growth as a broad measure of investment to examine the relation between investment and expected returns.
As outlined in academic studies such as Fama and French (2006 and 2015), when sorting all stocks on asset growth, we see large average spreads or differences in returns between stocks with high asset growth and stocks with low asset growth. This is driven by the underperformance of firms with high asset growth rather than the higher performance of firms with low asset growth. We see this pattern in returns among US stocks, developed markets ex US stocks, and emerging markets stocks over the sample periods examined in our study. Digging deeper, we find that the spreads in returns are mainly driven by the underperformance of small cap stocks with high investment. Exhibits 1a and 1b help illustrate this point. Exhibit 1a shows historical differences in returns for large cap stocks, sorted into deciles by year-on-year asset growth, in the US, developed ex US, and emerging markets. Exhibit 1b performs the same analysis within the small cap stock universe. In observing and interpreting these data, one can see that while the spreads in average returns in large caps are in the direction predicted by valuation theory, these spreads are weak, as indicated by the smaller magnitudes of the spreads and lower t-statistics. The magnitude of the spreads among small caps are larger and statistically unlikely to have occurred by random chance in all the markets tested. The weaker investment effect among large caps (when compared to small caps) is consistent with smaller differences in asset growth among large caps also shown in the exhibits. Therefore, it is not surprising the spreads in returns among large caps when sorting on asset growth are less than among small caps.
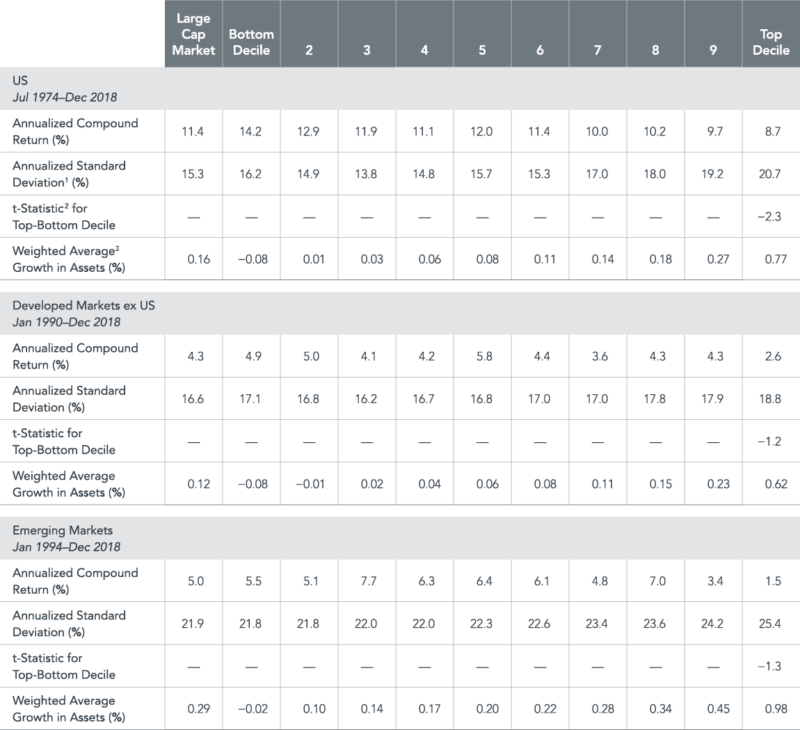
Exhibit 1a. Statistical Analysis of Hypothetical Large Cap Stock Returns Sorted by Asset Growth Deciles in the US, Developed ex US, and Emerging Markets
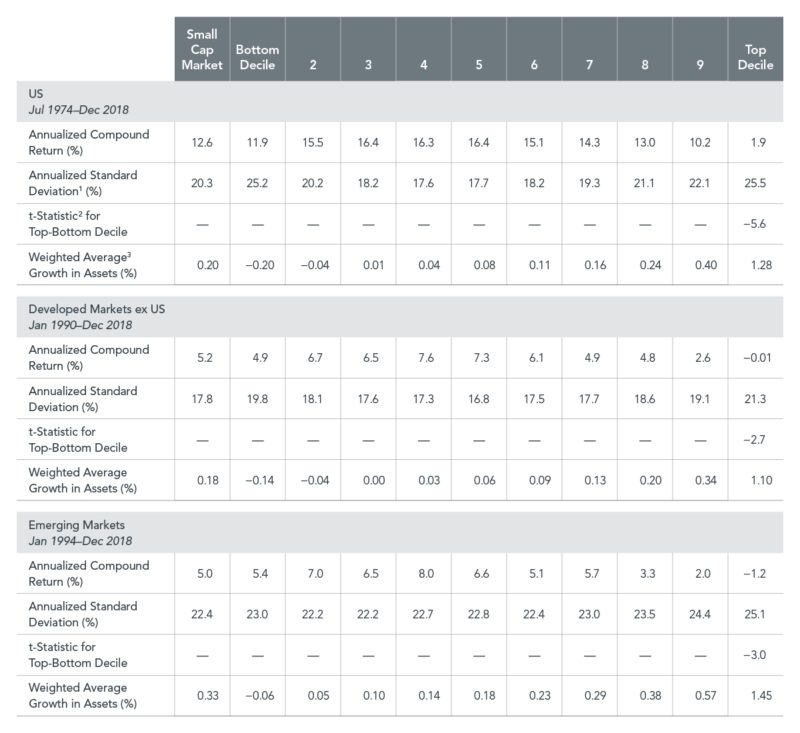
Exhibit 1b. Statistical Analysis of Hypothetical Small Cap Stock Returns Sorted by Asset Growth Deciles in the US, Developed ex US, and Emerging Markets
Other papers have shown that net stock issuance, net debt issuance, high capital investment, and high acquisitions are negatively related to future stock returns. Cooper et al. (2008), Lyandres et al. (2008), and Fama and French (2016) find investment helps explain the high average returns associated with share repurchases and the low average returns associated with equity and debt offerings. We also find that the investment effect helps explain the poor performance of firms with high stock issuance, high debt issuance, high merger and acquisition activity, high growth in physical capital, and high growth in intangible capital. Therefore, incorporating investment into an implementation process may help address a broad set of return patterns in the data in a comprehensive and systematic manner.
References
Cooper, Michael J., Huseyin Gulen, and Michael J. Schill. “Asset growth and the cross-section of stock returns.” Journal of Finance 63.4 (2008): 1609–1651.
Fama, Eugene F., and Kenneth R. French. “Profitability, investment and average returns.” Journal of Financial Economics 82.3 (2006): 491–518.
Fama, Eugene F., and Kenneth R. French. “A five-factor asset pricing model.” Journal of Financial Economics 116.1 (2015): 1–22.
Fama, Eugene F., and Kenneth R. French. “Dissecting anomalies with a five-factor model.” Review of Financial Studies 29.1 (2016): 69–103.
Lyandres, Evgeny, Le Sun, and Lu Zhang. “The new issues puzzle: Testing the investment-based explanation.” Review of Financial Studies 21.6 (2007): 2825–2855.
This article first appeared on the Dimensional Fund Advisors blog, Dimensional Perspectives.
For more insights from Dimensional Fund Advisors, here are some more articles from this series:
Has value really lost its vigour?
Booth & Fama: a friendship that changed investing
The best and worst of times
Do IPO returns match the hype?
Robert Merton: Technology and trust should go hand in hand
Ten questions investors need to ask