
By TIM EDWARDS, Managing Director, index Investment Strategy, S&P Dow Jones Indices
A new paper provides a fresh perspective on the active usage of products linked to S&P DJI indices, and illustrates the network of liquidity that has developed around the S&P 500® and other popular benchmarks. Liquidity risks.
“Active” and “passive” are colloquial terms, and it can be hard to distinguish one from the other at times. A portfolio replicating a broad, capitalisation-weighted index is the archetypal passive strategy, yet timing the market by buying and selling such a portfolio on a daily basis would qualify under most definitions of active investing.
Seeking for a precise definitional distinction between active and passive investments may be a distraction: some investors will trade more frequently than others, nearly all will adjust their positions over time. What is needed is a sense of not whether an investment strategy is active, but how much activity occurs.
Exchange-traded funds (ETFs) illustrate the point. An ETF tracking the S&P 500 is likely to be passively managed by the fund’s sponsor, but may have active owners who trade in and out of their positions frequently. Futures and options seem easier to classify: with their predetermined expiry dates, they are built to serve shorter-term needs. Yet such products can be used to replicate passive portfolio performance, potentially for years or decades if positions are rolled. Liquidity risks.
A window on index liquidity
Our new research provides a snapshot of trading volumes associated with the range of tradeable products linked to S&P DJI indices – including futures, ETFs, options and other listed products. These statistics begin to fill in some of the gaps in our understanding of the active use of ‘passive’ products, enabling us to infer average holding periods, or map out where liquidity may be found.
The data range over 1,300 individual products linked to 500 different indices, traded in more than 30 countries. With annual volumes in the trillions of US dollars for more popular indices, one conclusion of the research is that active investors play a major role in products linked to S&P DJI’s indices: average holding periods of a few months or less are typical. Liquidity risks.
The S&P 500 ecosystem
Since the launch of index options and futures in the 1980s, followed by ETFs in the 1990s, the S&P 500 index has provided the basis for investors to access a growing range of exposures. And, while several of our indices are associated to significant trading, the S&P 500 stands apart.
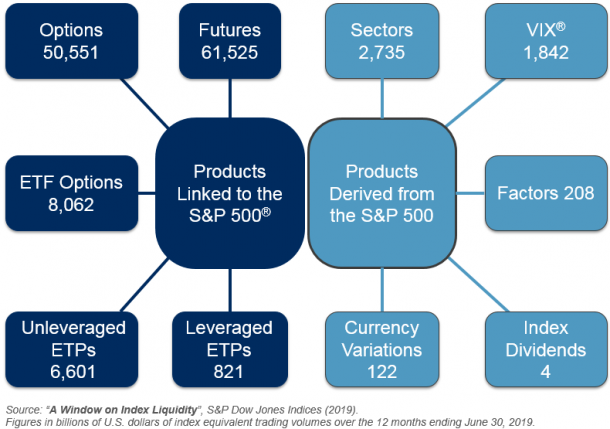
Over time, a S&P 500 ‘trading ecosystem’ has developed, with links extending across different product lines such as futures and options, and different — but related — indices such sectors, factors (“smart beta”) and other derivatives of the parent index. The paper illustrates this network, and the value of associated trading in billions of U.S. dollars in the 12 months ending June 30, 2019.
The S&P 500 Ecosystem – Index Equivalent Trading Volume in Billions of U.S. Dollars
The proportion of assets managed ‘passively’ has become a much-debated statistic, particularly for large-cap US equities. But some of the universe putatively owned by passive investors may be mislabelled. Click here to read the full report.
This article was for first posted on the Indexology Blog and is republished here with the kind permission of S&P Dow Jones Indices.
You may be interested in other research by S&P Dow Jones Indices we’ve covered on TEBI in recent weeks:
The impact of size on large-cap fund performance
The performance of low volatility
Does factor-based investing work in China?