
Intuitively, you would expect there to be a positive correlation between GDP growth and stock returns. But what does the academic evidence tell us? LARRY SWEDROE looks at the latest research.
Conventional wisdom can be defined as ideas so ingrained in our beliefs that they go unchallenged. Unfortunately, much of the conventional wisdom about investing is wrong. One example of erroneous conventional wisdom is that investors seeking higher returns should invest in countries that are forecasted to have high rates of economic growth, such as India and China.
It seems intuitively logical that if you could accurately forecast which countries have high rates of economic growth, you could exploit that knowledge and earn abnormal returns. Unfortunately, relying on intuition often leads to incorrect conclusions. In this case, it fails to account for the fact that markets are highly efficient in building information about future prospects into current prices, and investors fail to understand the difference between information and value-relevant information. The historical evidence on the correlation between country economic growth rates and stock returns demonstrates this point.
The evidence
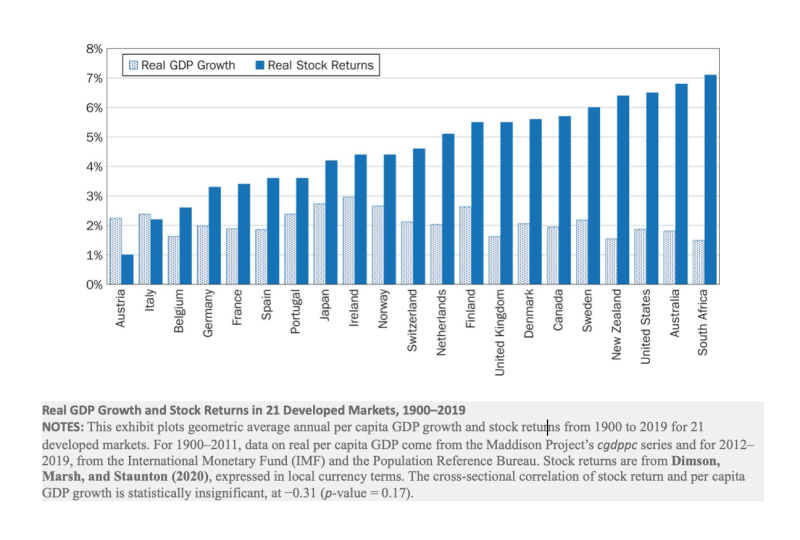
Jason Hsu, Jay Ritter, Phillip Wool and Yanxiang Zhao, authors of the 2022 study What Matters More for Emerging Markets Investors: Economic Growth or EPS Growth?, published in The Journal of Portfolio Management, used data from 15 emerging and 21 developed equity markets over samples ranging from 32 to 120 years to determine if GDP growth was a cross-sectional predictor of equity returns. Following is a summary of their findings:
- There was an absence of a reliable link between per capita GDP growth and stock returns in developed markets—the correlation was -0.31 with a p-value of 0.17 (not statistically significant).
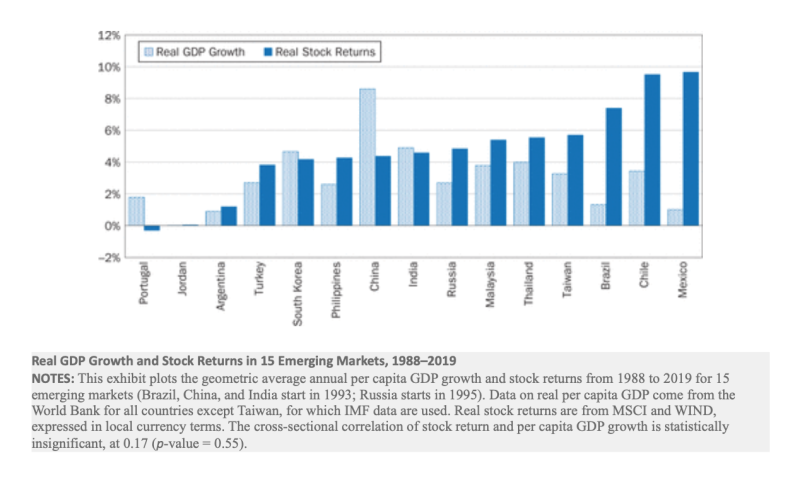
- In emerging markets, the cross-sectional correlation between annual real per capita GDP growth and stock returns was a statistically insignificant 0.17 (p-value of 0.55).
- There was a reliable positive relationship between real stock returns and real EPS (not earnings, but earnings per share). The correlation of real stock returns with real EPS growth was a strong and significant 0.53 (p-value = 0.04).
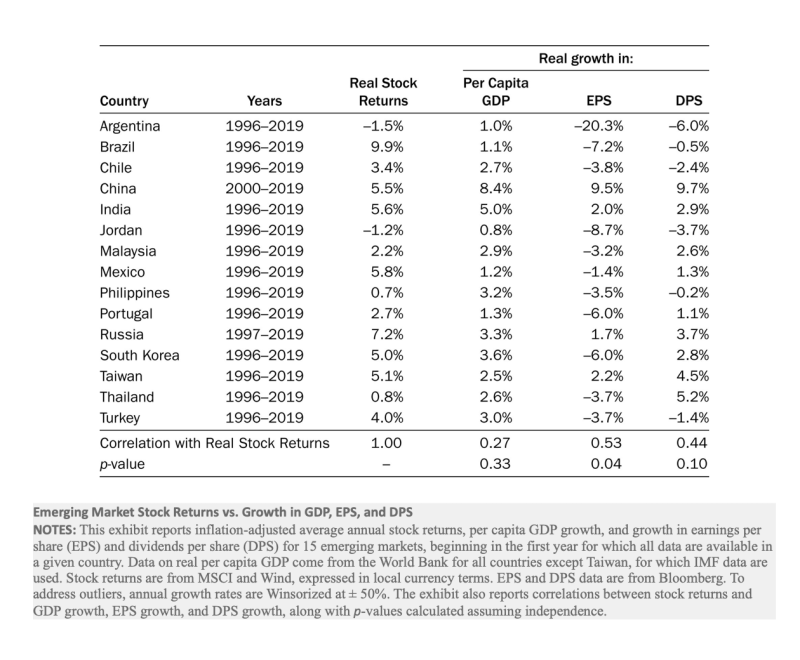
- While the majority of emerging markets exhibited meaningfully positive economic growth, they actually had negative EPS growth over time.
Their findings led Hsu, Ritter, Wool and Zhao to conclude: “These results suggest that, for predicting future stock returns, a focus on GDP growth is misguided.” They added: “There is no theoretical basis for expecting a positive correlation between a country’s stock returns and per capita income growth.”
Their findings are consistent with those of prior research demonstrating the lack of a positive relationship between economic growth and stock returns.
Confirming evidence
In their book Triumph of the Optimists, Elroy Dimson, Paul Marsh and Mike Staunton documented that over the 101-year period ending in 2000, there was a negative cross-sectional correlation between per capita economic growth in a country and its stock returns, with both of those variables adjusted for inflation. They have since updated their data through 2021 and show that a negative correlation continues to exist, though the relationship is not statistically significant.
In Credit Suisse’s Global Investment Returns Yearbook 2014, Dimson, Marsh and Staunton published their study The Growth Puzzle in which they not only found that past economic growth did not predict future equity returns but also that contemporaneous economic growth was not correlated with current stock market performance. Even if one knows precisely that the GDP growth of China will be higher than that of South Korea in 2023, there is no assurance that the 2023 stock market return for China will be higher than that for South Korea. However, they did find that stock returns this year predict economic growth next year—in the short run, high returns this year are associated with higher-than-average economic growth in the near future. That should not be a surprise, as the stock market is forward looking.
In its 2016 research paper Economic Growth and Equity Returns, Dimensional examined data on 23 developed country markets over the 40-year period 1975-2014, and for 19 emerging markets over the 20-year period 1995-2014, and found no significant relationship between short-term economic growth rates and stock returns. Countries were classified each year as either high or low growth depending on whether their GDP growth was above or below that year’s median, defined separately for developed and emerging markets. Researchers then looked at the stock market returns of high- and low-growth countries over the following year. The return for each group was the average stock market return of all the countries in that group weighted by countries’ market capitalisation. They not only found no statistically significant relationship between economic growth and future stock returns, but in both developed markets and emerging markets, the lower-growth economies produced higher returns.
In the developed markets group, the high-growth countries returned 12.0 percent in the following year, while the low-growth countries returned 13.1 percent, although they did so with higher volatility (21.2 percent versus 19.1 percent). In the emerging markets group, high-growth countries provided both higher returns (12.9 percent versus 12.6 percent) while exhibiting lower volatility (34.9 percent versus 38.9 percent).
Dimensional’s researchers then asked what would happen if economists had perfect foresight, which simply doesn’t exist in the real world. With perfect foresight, one could buy the stocks of countries with high economic growth rates and avoid (or short) the countries with low economic growth rates. Dimensional found that the low-growth countries in the developed markets group returned 13.2 percent versus 11.2 percent for the high-growth countries. However, it did find that in the emerging markets group, the opposite was true. Low-growth economies returned 11.4 percent (with an annual standard deviation of 36.2 percent) versus 13.5 percent for the high-growth countries (with an annual standard deviation of 37.2 percent).
Importantly, neither of the differences in returns was even close to being statistically significant at the 5 percent confidence level, with t-stats of about just 0.7. And remember, the strategy isn’t even implementable because we don’t have perfect foresight or even anything close to it.
In his 2015 study What’s Growth Got to Do With It? Equity Returns and Economic Growth, Joachim Klement examined the relationship between economic growth and stock returns. Using MSCI country indices, he investigated the equity market returns of 22 developed and 22 emerging markets for large-cap, mid-cap and small-cap stocks. He found that there was a large variation between growth in GDP per capita and equity market returns. For example, Singapore and Hong Kong showed the highest growth in GDP per capita of all developed countries but some of the lowest equity returns. Conversely, Australia and New Zealand had some of the highest equity market returns, with average or below-average growth in GDP per capita. Klement was unable to find any meaningful and statistically significant correlation between real stock returns and real GDP per capita growth for any size index. Since the economies of some countries (such as Germany, Switzerland and Korea) are more dependent than other countries (such as the United States) on exports, Klement also investigated the relationship between global growth and stock returns. While he did find a relationship, the correlations were small and only slightly positive.
In addition, Klement investigated the cross-country correlations between earnings and GDP per capita growth. Perhaps surprisingly, he once again found that “the correlations remain close to zero and may even be negative.” While it may seem paradoxical, Klement explained: “Earnings growth depends on the growth of productivity as well as input factors like labor and capital. Thus, real earnings growth may be higher even when GDP per capita growth is low if a country’s population is growing rapidly.” Conversely, for various reasons, low real earnings growth in emerging markets may occur despite rapid growth of the population.
In his 2012 study Is Economic Growth Good for Investors?, Jay Ritter found:
• For 19 countries with continuously operating stock markets during the 112-year period from 1900 through 2011, the correlation between equity returns and the growth rate of per capita GDP was -0.39 when measured in local currency. When measured in dollars, the correlation changed slightly, to -0.32. Investors in 1900 would actually have been better off investing in the companies of countries that experienced lower growth of their economies.
• Focusing on more recent data, during the 42-year period from 1970 through 2011, whether measured in local currency or dollars, the correlation between economic growth and stock returns was effectively zero.
• For 15 emerging markets, during the 24-year period 1988-2011, the correlation was -0.41 in local currency and -0.47 when measured in dollars. The data for China was particularly compelling: While economic growth in that country averaged about 9 percent, its stock returns were -5.5 percent per year.
In his wonderful book Expected Returns, Antti Ilmanen presented the following as evidence on the relationship (or lack of one) between real GDP growth and real stock returns. The table below covers the 22-year period from 1988 through 2009:
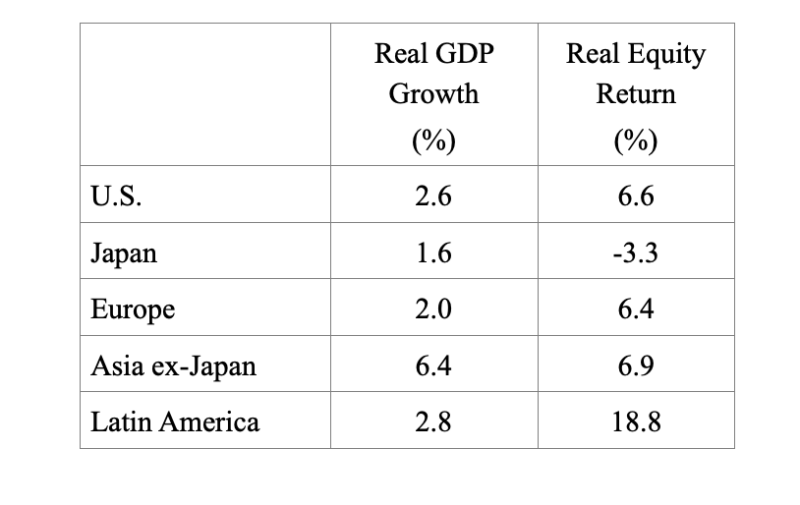
As further evidence, Ilmanen offered this example: For the period from 1993 through 2009, China’s annual real GDP growth rate averaged more than 10 percent. But a U.S. dollar-based investor would have earned negative nominal returns during that 17-year period. That’s not even accounting for inflation, which was about 2.5 percent. While China’s economy grew fivefold, investors lost money.
Investor takeaways
The evidence presented demonstrates that differences in GDP growth contain little information about the differences in stock returns in the same year or over the subsequent year. This means that it is difficult for investors to earn excess returns by relying on estimates of current or future GDP growth — even estimates that perfectly forecast GDP growth over the next 12 months. Why is the conventional wisdom of investors about economic growth and stock returns so at odds with the data? There are several explanations.
First, there is a general tendency for markets to assign higher price-to-earnings (P/E) ratios when economic growth is expected to be high, which has the effect of lowering realized returns. Countries that are expected to have strong economic growth can be perceived as safer places to invest. That translates into higher current valuations.
Second, the conventional wisdom fails to account for the fact that the markets price risk, not growth rates. High expected GDP growth rates already are built into a country’s current stock prices. The only advantage would come from being able to forecast surprises in growth rates. For example, if a country was forecasted to have 6 percent GDP growth and it actually experienced a growth rate of 7 percent, one might have had the chance to exploit such information (depending on how much it cost to make the forecasts and to execute the strategy). Unfortunately, there doesn’t seem to be any evidence that the ability to forecast GDP rates is any more reliable than the nonexistent ability to accurately forecast the markets.
Third, while economic growth is good for people (it produces not only a higher standard of living, but residents of countries with higher incomes have longer life spans and lower infant mortality rates), equity investors will not necessarily benefit. For example, a country can grow rapidly by applying more capital and labor without the owners of capital earning higher returns. And productivity gains can show up in higher real wages instead of increased profits.
Finally, the lack of a relationship between GDP growth and stock returns appears in stark contrast to the strong positive correlation between valuation measures (such as the CAPE 10) and real stock returns. The conclusion we can draw is that stock returns are predominantly driven by valuations, not economic growth. Investors price in future expected growth and reflect it in current valuations, no matter whether large, medium or small enterprises.
For informational and educational purposes only and should not be construed as specific accounting, legal, or tax advice. Certain information is based upon third party data which may become outdated or otherwise superseded. Third party information is deemed to be reliable, but its accuracy and completeness cannot be guaranteed. By clicking on any of the links above, you acknowledge that they are solely for your convenience, and do not necessarily imply any affiliations, sponsorships, endorsements or representations whatsoever by us regarding third-party websites. We are not responsible for the content, availability or privacy policies of these sites, and shall not be responsible or liable for any information, opinions, advice, products or services available on or through them. The opinions expressed by featured authors are their own and may not accurately reflect those of Buckingham Strategic Wealth® or Buckingham Strategic Partners®, collectively Buckingham Wealth Partners. Neither the Securities and Exchange Commission (SEC) nor any other federal or state agency have approved, determined the accuracy, or confirmed the adequacy of this article. LSR-22-365
LARRY SWEDROE is Chief Research Officer at Buckingham Strategic Wealth and the author of numerous books on investing.
ALSO BY LARRY SWEDROE
If you found this post interesting, you might also want to read these other articles that Larry has written about sustainable investing:
How do interest rates impact on REIT returns?
Do recency bias and loss aversion lead to mispricings?
How a 52-week high hurts returns
Identifying winning funds ex ante: Is it possible?
The impact of ESG uncertainty on asset prices
OUR STRATEGIC PARTNERS
Content such as this would not be possible without the support of our strategic partners, to whom we are very grateful.
TEBI’s principal partner in the UK is Sparrows Capital. We also have a strategic partner in Ireland — Biograph Wealth Advisors, a financial planning firm in Dublin.
We are currently seeking partnerships in North America and Australasia with firms that share our evidence-based and client-focused philosophy. If you’re interested in finding out more, do get in touch.
Picture: Xi Wang via Unsplash
© The Evidence-Based Investor MMXXII


