We often hear about the so-called behaviour gap — in other words, the difference between fund returns and the returns that investors in those funds actually receive. For some investors the gap can be huge. The good news is that, in some areas, things are improving, and investors are becoming more disciplined.
Every year the research team at Morningstar brings out a report called Mind the Gap. One of the key takeaways of the 2019 report, which has just been published, is that the behaviour gap is smaller for investors in low-cost funds.
This article by RUSSEL KINNEL, Morningstar’s Director of Mutual Fund Research, first appeared in the Fund Spy section of the Morningstar website and is republished here with permission.
Timing is the bane of investors everywhere. Low-cost funds.
We fear buying or selling at the wrong time. Given the volatility in markets, bad timing can cost you dearly. Everyone from new investors to administrators of giant pension funds and fund portfolio managers makes these errors.
We calculate Morningstar Investor Returns to understand how investors actually fared in a fund when you take cash flows into account. Essentially, we are asking, How did the average dollar in a fund do over a certain time period? Specifically, we can say the average investor lost 45 basis points to timing over five 10-year periods ended December 2018.
When I think about the costs of mistimed investments, I think 45 basis points is not a disaster. But the bottom 10% or so of bad timing might well be five or 10 times that for investors who really make huge moves, and that’s the sort of risk we want to guard against.

In our annual Mind the Gap study, we’ve updated our process for combining data for investor returns. The basic idea hasn’t changed: Compare asset-weighted internal rate of return calculations with category averages to see what was missed along the way. However, we’ve made three refinements aimed at more precisely capturing returns.
First, we included funds that were merged or liquidated during the time period in question, by building a category-level portfolio of flows and returns in which extinct funds are included up until the final partial month in which they went away. This change improves our results by capturing more of the poorly performing funds. We treat the final net assets before the fund is liquidated or merged as a sale. If those dollars went into another fund, we treat those incoming assets as a buy. Because fund mergers almost always occur within an asset class, those figures should be a wash on an asset-class basis.
The second change is in how we look at fund flows when rolling up to aggregate levels. In the past, we weighted a fund’s return based on its average of assets over the time period in question. Now, we are using a monthly portfolio method that allows us to weight using funds’ monthly flow figures to better capture the ups and downs in flows.
Third, for the first time we are including exchange-traded funds in our study. We compare monthly net assets at ETFs to infer a flow for the month. Essentially, it means we are evaluating long-term investors in ETFs. There is huge intraday trading at ETFs that this doesn’t capture, so a key piece of the puzzle is excluded from our calculation.
For our study, we looked at 10-year returns for the years ended 2014, 2015, 2016, 2017, and 2018. We then calculated an average of those because the start and end dates can have a big impact on investor returns. In general, the gap widens around dramatic market reversals such as those seen in 2008 and 2009, because some investors panic and sell near the bottom, thus missing out on a dramatic rebound. In steadier years, investors are less inclined to attempt to time markets.
I should also note that we exclude funds of funds from our overall figures, but include them when we break out asset-allocation funds because they are such a big part of the asset-allocation universe.
Asset class breakdown
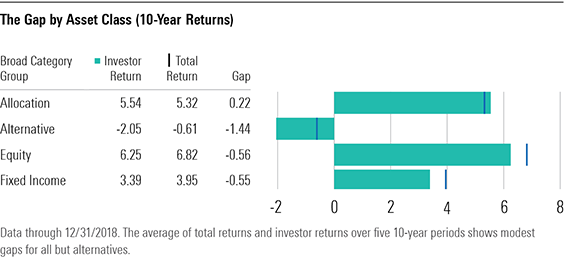
If we drill down to broad category groups, we see some stark differences. On the one hand, allocation funds produced a positive gap of 0.22% on annualized returns of 5.54%. A positive gap means a majority of the money going in was well-timed. The reasons are instructive about what works best for investors.
First, because allocation funds are a mix of stocks and bonds, their returns are generally muted. As such, they tend to not produce huge returns that inspire the greedy to rush in, nor losses that cause the fearful to flee. Second, this is where target-date funds live. Target-date funds are fairly low-volatility funds depending on the retirement date, and they are held almost exclusively in 401(k)s where investors keep plugging away with contributions every pay cheque through all the highs and lows of the markets. That combination of modest volatility and disciplined investing is what we should strive for.
On the other hand, we have alternatives. Alternative funds have low returns and are generally supposed to have the sort of low market correlation that makes them good diversifiers for portfolios. But they don’t appear to have helped many. The average annualized return was negative 0.61%, and investors made things worse with bad timing that left them with an annualized loss of 2.05%, summing up to a gap of 144 basis points.
MyJuly 2017 cover story in Morningstar FundInvestor featured tales of alternatives funds like MainStay Marketfield that produced good returns with little in assets, attracted huge sums, then had terrible results and watched all the money leave. The difficulty of alternatives funds is equally instructive. Although some don’t have extreme volatility, they are very complicated strategies that often fail to perform with real money on the line. And investors seem to have unrealistic expectations of alternatives funds.
They hope for all the upside and none of the downside, and quickly give up when the funds lose money. Complexity may be as much of a bugaboo for investors as volatility.


In the middle are equity and fixed-income funds, which have gaps of 56 basis points and 55 basis points, respectively. When you consider that the equity funds started with returns of 6.8% annualized versus 3.4% for bond funds, it makes bond funds the real disappointment here.
We’ve seen municipal-bond fund investors make things worse by selling after reading scary headlines that made fundamentals seem worse than they were. That explains some of the problem, but I don’t really have an explanation that fully explains why the gap is not smaller for bond funds.
Factor analysis
We can also look at how investors do when we group investments by expense ratio and volatility. To me these tests are more interesting than the overall results because they give us some insight into the cause of the problems.
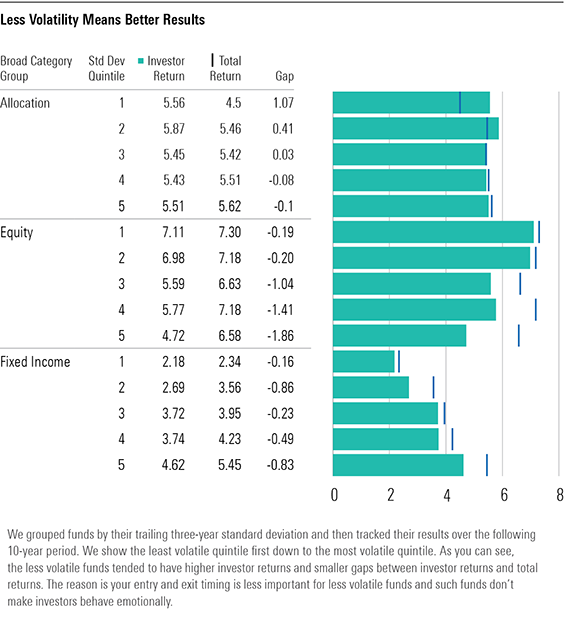
We broke down funds within asset class based on their standard deviation. Lo and behold, we saw a consistent story across asset classes. Funds in the least-volatile quintiles had better investor returns than those in more-volatile quintiles. Our look at other factors was within categories, but in this case, we did it within asset classes because the differences in volatility within categories tends to be small.
What’s going on is that boring funds are working well for people as they don’t inspire fear or greed. Also, timing is simply less important when a fund has lower standard deviation.
When we look at fees, the story is also clear cut. Low cost funds tend to lead to higher total returns and higher investor returns. Costs are good predictors of performance, so this makes intuitive sense.
A second factor in good investor returns might be that low-cost funds attract savvier planners and individual investors who make better use of their funds.
In any case, you’ll notice that investor returns are higher for cheaper funds and that the gap grows more as you get to higher cost funds. That means that you have bad timing and lower returns in high-cost funds. This underscores why costs should play a large role in fund selection.
Conclusion
To make the most of your mutual funds, you need a good plan and the willingness to stick with it amid all the drama in the markets. In addition, it helps to know if volatility in individual funds is the sort of thing that will cause you to sell to just stop the pain. If so, seek out less risky funds such as allocation funds. Your plan should include shifts to less-risky assets over time so that you don’t wake up to a bear market and realise you are at 85% equities when you should be at 60% equities. Automatic investing plans seem to work quite well as a saving discipline and as a way to keep emotions out of the process.
A second piece of investor success is knowing your investments. The more you know about your funds, the less likely you are to be disappointed. Remember that no active manager will sail through every storm with flying colours.
Even reviewing calendar-year returns as far back as you can will help you have a tangible idea of the risks. Virtually every index lost more than 30% in 2008 and more than 50% from peak to trough. Those who held their ground were richly rewarded, but it’s not easy to do that.
A good plan and patience will serve you well.
If you found Russel Kinnel’s article interesting, you might also enjoy our recent podcast interview with George Kinder on the benefits of mindful investing:
George Kinder on the benefits of mindful investing
Picture: Bruno Figueiredo via Unsplash


