
By LARRY SWEDROE
Since behaviour can have an even larger impact on returns than investment policy (asset allocation), the study of investor behaviour is a rich field for academics to mine. An interesting question is whether institutional investors, generally considered to be sophisticated, behave differently from individual investors, generally considered to be “naïve”.
Andrew Lo, Alexander Remorov and Zied Ben Chaouch, authors of the January 2019 study Measuring Risk Preferences and Asset-Allocation Decisions: A Global Survey Analysis, sought to answer that question. Among their key findings was that individual investors tend to mostly extrapolate past performance in their asset allocation (they are subject to recency bias), while institutional investors are mostly contrarian in their investment decisions (rebalancing leads to selling during bull markets and buying during bear markets) — and the differences in the reactions were highly statistically significant and very large. These findings held around the globe.
As an example of the differences in behaviour, they found that following a decline in the S&P 500 of 10-20 percent, while 44 percent of individuals would decrease equity allocation, just 17 percent of institutions would do so. At the same time, 67 percent of institutions and 52 percent of advisors would increase equity allocation versus just 17 percent of individuals. With a rise in the S&P 500, the results reversed: For individuals, 30 percent would decrease allocation and 32 percent would increase it versus 68 percent and 9 percent for institutions. Thus, on average, individual investors would change their allocation in the same direction as a recent S&P 500 move (recency bias), while institutional investors would change their allocations in the opposite direction.
In other words, institutions were likely rebalancing, adhering to their asset allocation plans, while individuals were performance chasing, leading to panic selling during bear markets. This was especially true of younger investors.
Their questions also allowed the authors to identify five distinct types of individual investors: passive investors, extrapolators, risk avoiders, contrarians and optimistic investors. They found:
- Extrapolators (27 percent) tend to decrease their equities allocation following bad market performance and increase it following good returns, extrapolating past trends.
- Passive investors (35 percent) leave their allocation unchanged in both scenarios.
- Risk avoiders (19 percent) significantly cut their equities allocation when they see large moves in the S&P 500 in either direction. This group had the lowest average age, predominantly consisting of millennials.
- Contrarians (8 percent) tend to increase their equities allocation following bad market performance and decrease it following good returns — they act like institutional investors.
- Optimistic investors (11 percent) tend to increase their allocation in either scenario. The U.S. has the highest percentage of investors in this cohort.
Based on their findings Lo, Remorov and Ben Chaouch concluded: “Because individual investors tend to have extrapolative reactions, while institutional investors tend to have contrarian ones, we conclude that institutions generally take the other side of individual investor trades in broad asset allocations.”
New evidence
Daniel Elkind, Kathryn Kaminski, Andrew Lo, Kien Wei Siah and Chi Heem Wong contribute to the behavioral finance literature with their study When Do Investors Freak Out? Machine Learning Predictions of Panic Selling, published in the Winter 2022 issue of The Journal of Financial Data Science. Using a dataset of 653,455 individual brokerage accounts belonging to 298,556 households, they documented the frequency, timing and duration of panic sales, defined as a decline of 90 percent of a household account’s equity assets, of which 50 percent or more was due to trades, over the course of one month. Their data sample covered the period 2003-2015. Following is a summary of their findings:
- Although panic sales are infrequent, with only 0.1 percent of investors panic selling at any point in time, they occur at up to three times the baseline frequency when there are large market movements.
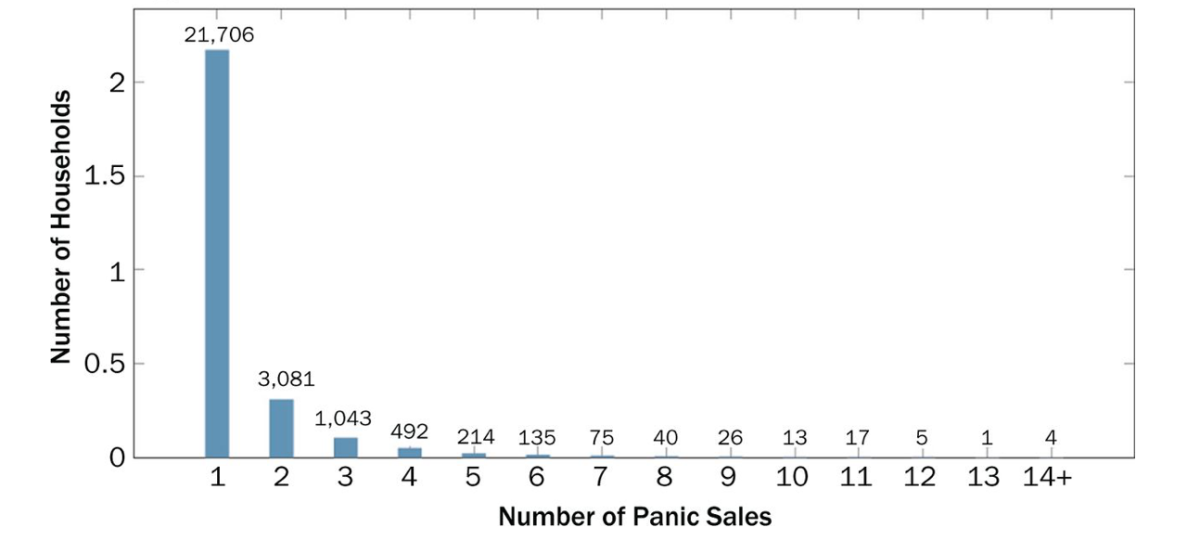
- Nine percent of households engaged in panicked selling across the 13 years between January 2003 and December 2015. Of those who “freaked out”. 81 percent did so once, 11 percent did so twice, and the remainder did so more frequently (see chart below).
- 31 percent of investors who panic sold never returned to reinvest in risky assets — of those who did, 59 percent re-entered the market within five months, and 13 percent did so within ten months.
- A higher proportion of investors who were male, above the age of 45, married, or had a greater number of dependants tended to freak out.
- Those who declared themselves to have excellent investment experience or knowledge were more prone to engage in panic selling. Those who declared themselves to have no investment experience were less likely to panic sell or freak out.
- Although decreasing the thresholds increases the number of panic sales identified across all time periods, there is still a disproportionate number of accounts that panic sell in periods of high financial stress.
- Artificial intelligence techniques can identify individuals at risk of panic selling in the near future when given the demographic characteristics of the investor, their portfolio histories, and current and past market conditions — the best-performing deep neural network achieved a 70 percent true positive accuracy rate and an 81 percent true negative accuracy rate.
The authors noted that panic selling acts as a stop-loss mechanism in rapidly deteriorating markets, and that can prove beneficial. However, that depends on investors returning to the market in a timely fashion (selling means you have to be right twice), and they found that almost a third of those who engaged in panic selling never returned. They also found that the median investor earned a slightly negative return after liquidating.
Investor takeaways
While academics have identified many anomalies for asset pricing models, I believe the greatest anomaly of them all is that while investors idolise Warren Buffett, so many of them not only ignore his advice to avoid timing the market but also his advice (if they cannot resist that temptation) to “be fearful when others are greedy and greedy when others are fearful”. In other words, they tend to do the opposite. In addition, most financial advisers have long advised their clients to stay calm and stick with their well-thought-out plan that anticipates bear markets, weathering any passing financial storm in their portfolios. Instead, far too many individual investors engage in panic selling.
One likely explanation for their “freaking out” is that the investors were overconfident of their ability to deal with the stress created by sharp declines. The finding that males are more prone to panic selling should not be a surprise, as research has found that men tend to be more confident of their skills (skills they don’t have) than women.
Another unsurprising finding is that those who declared themselves to have excellent investment experience or knowledge were more prone to engage in panic selling. Overconfidence leads to expensive mistakes. I suggest you ask yourself which of the five individual investor types best describes your own past behavior. If you are honest, that knowledge should help you determine the right allocation for risk assets, like stocks, for your portfolio.
For informational and educational purposes only and should not be construed as specific investment, accounting, legal, or tax advice. Certain information is based upon third party data which may become outdated or otherwise superseded without notice. Third party information is deemed to be reliable, however its accuracy and completeness cannot be guaranteed. By clicking on any of the links above, you acknowledge that they are solely for your convenience, and do not necessarily imply any affiliations, sponsorships, endorsements or representations whatsoever by us regarding third-party websites. We are not responsible for the content, availability or privacy policies of these sites, and shall not be responsible or liable for any information, opinions, advice, products or services available on or through them. The opinions expressed by featured authors are their own and may not accurately reflect those of the Buckingham Strategic Wealth® or Buckingham Strategic Partners®, collectively Buckingham Wealth Partners. Neither the Securities and Exchange Commission (SEC) nor any other federal or state agency have approved, determined the accuracy, or confirmed the accuracy of this article. LSR-22-237
LARRY SWEDROE is Chief Research Officer at Buckingham Strategic Wealth and the author of numerous books on investing.
ALSO BY LARRY SWEDROE
Factors DO work, but don’t try to time them
Explaining value and momentum with macroeconomic risks
Should investors fear a yield curve inversion?
More evidence that specialised ETFs are best avoided
Disposition effect hampers active managers, study shows
OUR STRATEGIC PARTNERS
Content such as this would not be possible without the support of our strategic partners, to whom we are very grateful.
TEBI’s principal partners in the UK are S&P Dow Jones Indices and Sparrows Capital.We also have a strategic partner in Ireland — PFP Financial Services, a financial planning firm in Dublin.
We are currently seeking partnerships in North America and Australasia with firms that share our evidence-based and client-focused philosophy. If you’re interested in finding out more, do get in touch.
Picture: Usman Yousaf via Unsplash
© The Evidence-Based Investor MMXXII


