
By LARRY SWEDROE
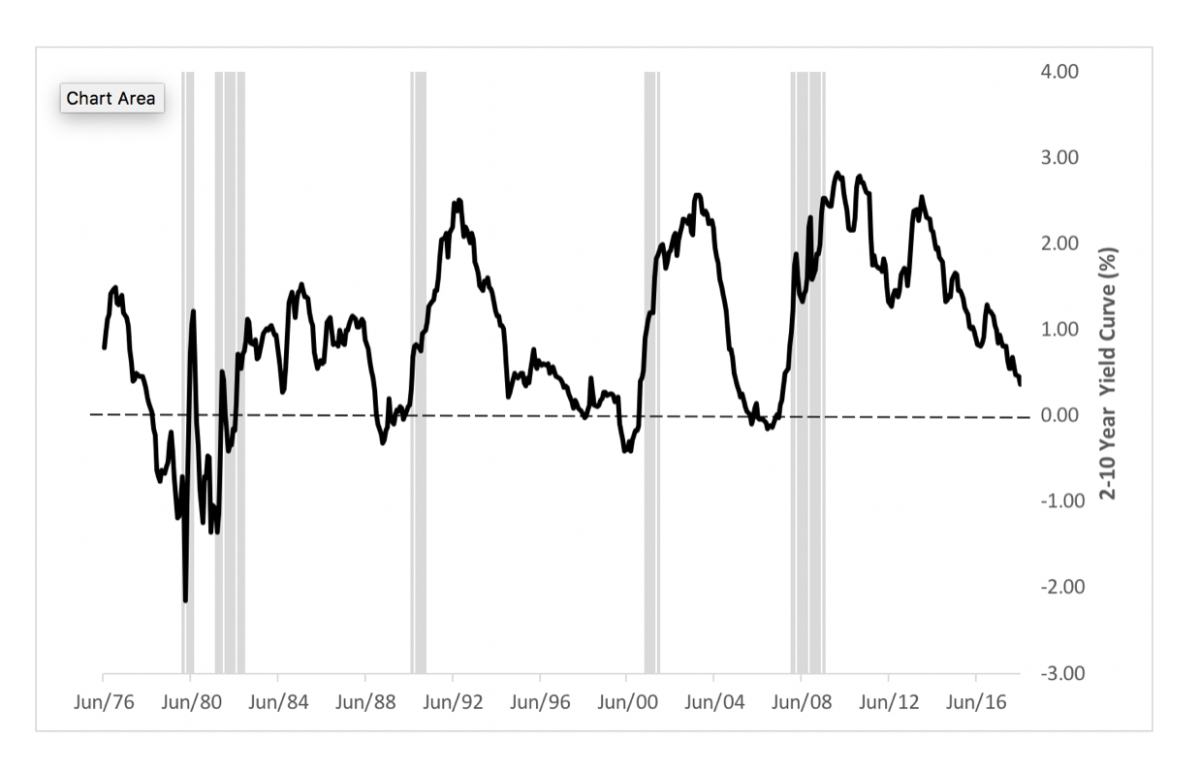
It’s not as if investors did not have enough to worry about with Russia invading Ukraine, but with inflation being much more persistent than the Federal Reserve and many economists believed it would be, the bond market has priced in a series of rate hikes for this year. That has led to a significant flattening of the Treasury yield curve. As I write this on March 7, 2022, the spread between the two-year Treasury note and the 10-year Treasury note has narrowed to just 21 basis points (1.53 percent versus 1.74 percent). That narrowing has led to concerns about the potential for a yield curve inversion. The reason for the concern is the much-publicised relationship between inversions and recessions (typically recognised as two consecutive quarters of economic decline as reflected by the gross domestic product): Inverted curves have predicted all nine U.S. recessions since 1955.
The relationship can be observed in the following chart from WealthManagement.com, which shows the yield spread between two-year Treasury notes and 10-year Treasury notes (the traditional measure for inversions) during the most recent recessions (shaded in grey):
To help determine if equity investors should be worried about a yield curve inversion, we look as always to the evidence for guidance. We’ll begin with a review of an article from Dimensional.
Stock returns following yield curve inversions
In an August 2018 article, What Does a Yield Curve Inversion Mean for Investors?, Dimensional examined the returns to stocks following inversions for five major developed nations, including the United States, since 1985. The article states: “Equity returns (as measured by MSCI local currency indices) were a mixed bag in the three years following an inversion, with US index returns higher 66% of the time at the 12-month mark and only 33% of the time 36 months later. When all countries are included, returns of the indices were higher 86% of the time 12 months later and 71% of the time 36 months later.” Dimensional concluded: “It is difficult to predict the timing and direction of equity market moves following a yield curve inversion.”
Eugene Fama and Ken French also examined the relationship between inverted yield curves and equity returns in their 2019 working paper, Inverted Yield Curves and Expected Stock Returns. Taking the perspective of a U.S. investor, they examined returns using monthly stock and government bonds data for the United States and 11 other major markets. Their data sample began in January 1975 with six countries, including the U.S. The sample grew to 10 countries by 1990, and the last two, Belgium and Italy, were added in 1991. The tests ended in December 2018. Depending on the data available, they considered up to six term spreads in a country, comparing one-month, one-year and two-year short-term yields with five- and ten-year long-term yields. Each security’s weight in a country was proportional to its market cap, and each country’s weight in the World or World ex-U.S. portfolio was proportional to the aggregate market cap of the country’s stocks.
Their default or passive strategy delivered the U.S. dollar return on one of three stock portfolios: the U.S. stock market, the portfolio of available markets outside the U.S. (World ex-U.S.), or the World portfolio of all available markets. The active strategy for the U.S. replaced the stock market with one-month Treasury bills when the U.S. term spread was negative. The active strategies for World and World ex-U.S. combined the dollar-denominated returns from country-specific strategies that followed the same rules as the U.S. strategy, replacing a country’s stock market with U.S. T-bills when its local yield curve was inverted. To reduce the likelihood that some signals triggering the active strategy were data errors or other noise, they ignored a negative term spread unless the spreads for the prior two months were also negative (increasing the requirement from three consecutive negative spreads to six had no meaningful effect on the results). Following is a summary of their findings:
- World ex-U.S. and World had about five times as many inverted months (216 and 225, respectively, versus 44 for U.S.).
- The 1975-2018 average annualised difference between the monthly returns on the value-weighted portfolio of U.S. stocks and one-month T-bills was 8.3 percent (t-stat = 3.6). The average equity premiums for World ex-U.S. and World were 6.8 percent (t-stat = 2.7) and 7.3 percent (t = 3.3), respectively—the large and statistically reliably positive unconditional equity premiums are a challenge to investors who try to increase their expected return by using the term spread to time the premium.
- A large fraction of term spread strategies―67 of 72―reduced the investment payoff for 1975-2018 by following their active strategy rule (without even considering the impact of trading costs or taxes).
Their findings led Fama and French to conclude: “We find no evidence that yield curve inversions can help investors avoid poor stock returns.” They added: “Inverted yield curves provide no information about future excess stock returns.” In other words, the negative realised premiums from the active strategy were the cost of uninformed bets against the equity premium.
My colleague, Jared Kizer, also took a look at returns following yield curve inversions. Jared examined inversions, defined as the spread between two-year and five-year Treasuries, and found that the three years following an inversion produced a total market beta premium of just under 3 percent, and the five years following one produced a total market beta premium of almost 11 percent. Jared also noted a very wide range of outcomes for the market beta premium over both horizons, but particularly for the five-year period. Among five-year periods, four results had negative total returns (although two of those overlapped), with two of them being negative total returns in excess of 30 percent (the largest negative total premium was -42 percent). However, in some five-year periods, the total market beta premium was substantially positive, with a few results in excess of 50 percent (the largest was 69 percent). In other words, U.S. stock market returns have tended to be lower than their historical average, but still positive, following periods of yield curve inversion.
Latest research
Mitchell Quinn, Lei Zhang and Lin Mi, authors of the study Yield Curve Inversions: A Study of Country-level and Firm-level Stock Reactions, published in the March 2022 issue of the International Review of Finance, examined the short-term stock and corporate bond reactions to yield curve inversions in 41 countries. They constructed three types of term spreads for each country: 10-year minus 3-month yields (10Y3M), 10-year minus 1-year yields (10Y1Y) and 10-year minus 2-year yields (10Y2Y). They defined inversion days in two ways: unrestricted (the term spread being greater than 0 in the previous day but less than 1 basis point on the inversion day) and restricted (those inversions that did not follow a previous inversion within the past 10 trading days).
They began by noting that the last two times the U.S. yield curve inverted, the equity market had an immediate negative reaction: “On March 22, 2019, the yield curve (10-year minus 3-month US Treasuries) inverted for the first time since the end of the Global Financial Crisis (GFC). On the same day, the S&P500 dropped 1.93%. On January 31, 2020, the yield curve inverted again and the S&P500 fell by 1.77%.” Following is a summary of their findings:
- While the U.S. exhibited negative stock returns on days of restricted 10Y3M inversions (averaging -0.59 percent, significant at the 5 percent level), in some other countries it was not pervasive, as only 13 out of 41 countries exhibited significantly negative short-term stock returns when yield curves inverted.
- Company stocks exhibited strong responses to inversions in the yields on their bonds, with three-day cumulative abnormal returns averaging -1.22 percent globally and -2.83 percent for U.S. firms—suggesting that corporate bond yield curves contain valuable information of firms’ future performance.
The bottom line is that there doesn’t seem to be any convincing evidence that an active strategy of shifting away from equities when yield curves invert is likely to add value, especially after considering transaction costs and taxes.
Other considerations
One trait that differentiates sophisticated from naive investors is that sophisticated investors understand that when it comes to interest rates, what matters is not just their relative level but also whether the Fed’s policy is accommodative or contractionary. The reason we have experienced recessions after inversions is that Fed policy was contractionary as it tried to fight inflationary pressures. By raising short-term real interest rates to levels sufficient to slow demand and fight inflation, the Fed can cause an economic slowdown and even an outright recession. With this understanding, we should ask whether Fed policy is currently in a contractionary or accommodative regime.
When it comes to monetary policy, it is the level of real interest rates, or the inflation-adjusted one-month Treasury bill rate, that matters (alternatively, look at the yields on Treasury Inflation Protected Securities, which are currently negative out to 30 years). The real rate on one-month Treasury bills has been positive, averaging 0.7 percent over the last seven decades (1952-2021). However, beginning in 2009, the real yield on the one-month Treasury bill has been negative, as the Federal Reserve has kept policy accommodative since then.
The latest forecast from the Federal Reserve Bank of Philadelphia’s Survey of Professional Forecasters is that inflation will be 5.5 percent in 2022. With the current one-month Treasury bill at 0.11 , we have a real one-month Treasury bill rate of -4.4 percent, more than 5 percentage points below the average of the last 70 years. Clearly, monetary policy is still highly accommodative and supportive of economic growth. Thus, as long as the real federal funds rate remains at negative or relatively low levels, investors should temper concerns they have about an inversion in the yield curve. In addition to relatively loose monetary policy, there is also massively stimulative fiscal policy, with the budget deficit at about $2 trillion. That doesn’t mean a recession is not possible, as one can be caused by exogenous events (such as geopolitical events like the invasion of the Ukraine), but it isn’t going to be caused by monetary or fiscal policy that is too tight. It’s also worth noting that the latest consensus forecast of professional economists is for GDP growth in 2022 of 3.7 percent, and growth in the third and fourth quarters of 3.0 percent and 2.9 percent, respectively. In addition, the forecast for 2023 is for real growth of 2.7 percent.
Another reason to not focus on the flattening of the yield curve we have experienced is that the flattening has mostly occurred at the longer end. While U.S. interest rates are well below historical levels, they are still well above those of most other developed countries. For example, on March 7, 2022, the yield on 10-year U.K. gilts was just 1.3 percent. The yield on Japanese 10-year government bonds was even lower, at 0.14 percent. And the yield on 10-year German bunds was slightly negative, at -0.20 percent. Those low yields have led to the U.S. Treasury bond market attracting capital, suppressing our longer-term yields and flattening the curve. Normally, a flattening of the yield curve might signal that the market is expecting weaker economic growth. However, today it could just as likely be a result of “safe-haven demand,” including demand caused by Russia’s invasion of Ukraine—capital flows to the United States, as our economy is less likely to be negatively impacted than other countries because it is not reliant on Russian or Ukrainian energy or food products.
There’s one other important point to remember: If the yield curve did eventually invert due to a weakening of the economy, it is likely that Fed policy would become even more accommodative, reducing the risks of a recession and a bear market.
Investor takeaways
While an inverted yield curve may be a reliable indicator that a recession is likely to begin, within 16 months on average, the evidence demonstrates it is not an indicator reliable enough to allow you to profitably time stock markets. That should not come as a surprise, as there is no evidence that active managers have been able to exploit any signal provided by well-publicised information on the predictive nature of yield curve inversions. If there were, we would see it in the annual S&P Dow Jones Indices versus Active (SPIVA) scorecards. But none exists, in either the stock or bond market.
Remember, if information is well known, any predictive value it contains is already built into current prices. Thus, it’s unlikely you can use it to generate outperformance. Investors fail to differentiate between information and value-relevant information, trading on what is nothing more than information that has no value. Certainly, if you hear it on TV or read it in the newspaper, it is way too late to act on it.
There will always be something for investors to worry about, which is why Warren Buffett warned that once you have ordinary intelligence, success in investing is determined far more by temperament — the ability to ignore the noise of the markets and adhere to your well-thought-out plan that incorporates the risks of negative events. Hopefully, your investment plan reflects the certainty that negative events, including unforecastable black swan events, will occur with a high degree of regularity and ensures you are not taking more risk than you have the ability, willingness and need to take. Getting that right increases your ability to ignore the noise of the market and raises the odds that your head, not your stomach, will be making investment decisions. I’ve yet to meet a stomach that makes good decisions.
Summarising, the strategy most likely to allow you to achieve your financial goals is to develop and adhere to a long-term plan in line with your ability, willingness and need to take risk. By doing so, you will be better able to look past the noise of the market and focus on investing in a systematic way that will help you meet long-term goals.
For informational and educational purposes only and should not be construed as specific investment, accounting, legal, or tax advice. Certain information is based upon third party data which may become outdated or otherwise superseded without notice. Third party information is deemed to be reliable, however its accuracy and completeness cannot be guaranteed. Information from sources deemed reliable, but its accuracy cannot be guaranteed. Investing involves risk including potential loss of principal. By clicking on any of the links above, you acknowledge that they are solely for your convenience, and do not necessarily imply any affiliations, sponsorships, endorsements or representations whatsoever by us regarding third-party websites. We are not responsible for the content, availability or privacy policies of these sites, and shall not be responsible or liable for any information, opinions, advice, products or services available on or through them. The opinions expressed by featured authors are their own and may not accurately reflect those of the Buckingham Strategic Wealth® or Buckingham Strategic Partners®, collectively Buckingham Wealth Partners. Neither the Securities and Exchange Commission (SEC) nor any other federal or state agency have approved, determined the accuracy, or confirmed the accuracy of this article. LSR-22-259
LARRY SWEDROE is Chief Research Officer at Buckingham Strategic Wealth and the author of numerous books on investing.
ALSO BY LARRY SWEDROE
More evidence that specialised ETFs are best avoided
Disposition effect hampers active managers, study shows
Should investors fear rising public debt?
Climate alphas as predictors of future returns
Lifestyle funds: Do they add or subtract value?
New evidence on how investor emotions affect markets
CONTENT FOR ADVICE FIRMS
Through our partners at Regis Media, TEBI provides a wide range of high-quality content for financial advice and planning firms. The material is designed to help educate clients and to engage with prospects.
As well as exclusive content, we also offer pre-produced videos, eGuides and articles which explain how investing works and the valuable role that a good financial adviser can play.
If you would like to find out more, why not visit the Regis Media website and YouTube channel? If you have any specific enquiries, email Robin Powell, who will be happy to help you.
© The Evidence-Based Investor MMXXII


