
By CRAIG LAZZARA
Anyone even vaguely conversant with our SPIVA Scorecards will realise that most active managers underperform passive benchmarks most of the time. This result is robust across geographies and across time, and is reflected in our recently issued mid-year 2023 report for the USA, which shows, yet again, that US active managers continue to struggle.
Although the scorecard covers 39 categories of equity and fixed income managers, the largest and most closely watched comparison is that between large-cap U.S. equity managers and the S&P 500. Exhibit 1 shows that 60% of large-cap managers underperformed the S&P 500 in the first six months of 2023; not since 2009 has a majority of large-cap managers outperformed.
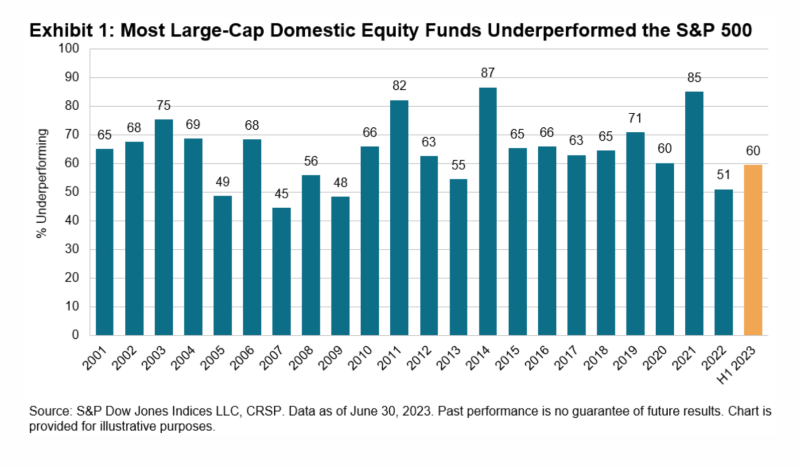
More important than the last six months’ results is the long-run record of active performance, and here our mid-year report is consistent with its predecessors: as time periods lengthen, active outperformance becomes harder to find. Although “only” 60% of large-cap managers lagged the S&P 500 in the first six months of 2023, after 10 years the underperformance rate is 86%, and after 20 years it’s 94%. We see similar results across all manager categories.
The deterioration of results over the long term is strong inferential evidence that the true likelihood of active outperformance is less than 50%; if this were not so, we would expect longer-term results to be better than shorter. As we’ve observed before, skill persists, while luck is ephemeral.
There are good reasons why active managers typically underperform, but market movements in early 2023 exacerbated the challenge. Exhibit 2 illustrates the shift in relative sectoral performance between 2022 and the first six months of this year.
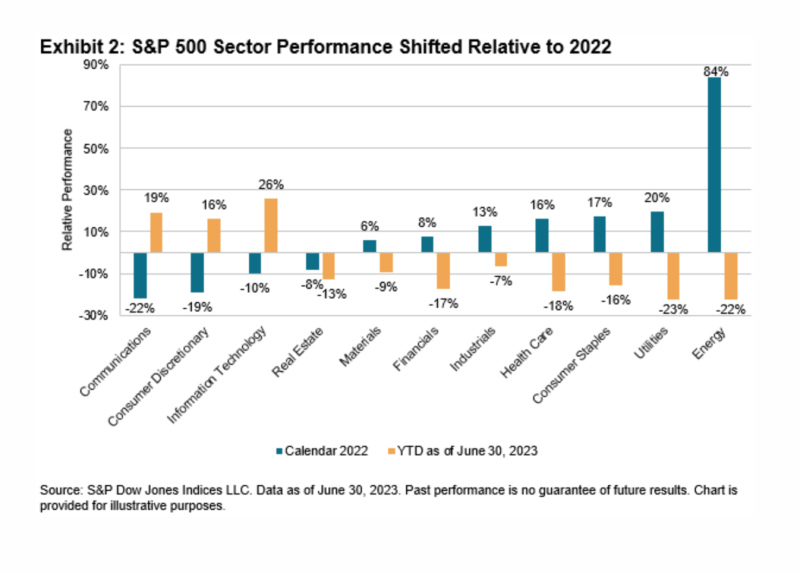
The three worst-performing sectors in 2022 were the only three sectors to beat the S&P 500 in the first half of 2023. For an active manager to navigate through such a sector reversal is difficult in any circumstance, and especially so when, as now, the three sectors coming into favor are also the three with the index’s highest average capitalization. As Exhibit 3 illustrates, the average return of the stocks in the S&P 500’s largest capitalisation decile was more than double the average return of the next-best-performing decile.
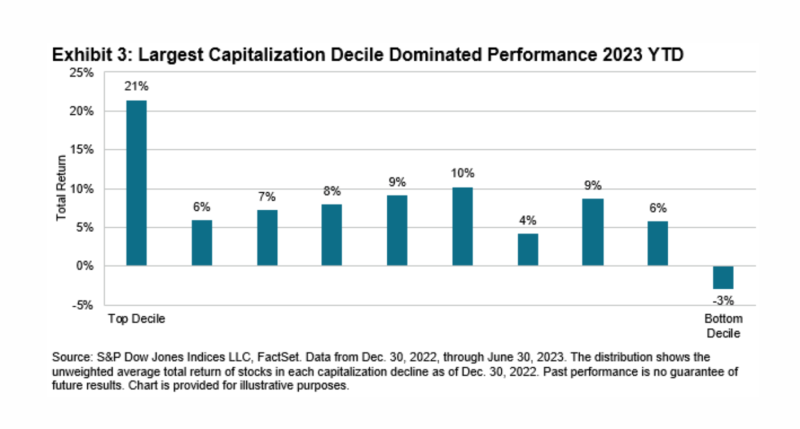
When an index’s largest constituents are among its best performers, active management becomes especially difficult: the larger a stock’s index weight is, the less likely it is that active managers will overweight it. The relatively weak performance of the largest stocks helped to explain the comparatively good performance of active managers in 2022, just as their relatively strong performance in early 2023 served as a headwind.
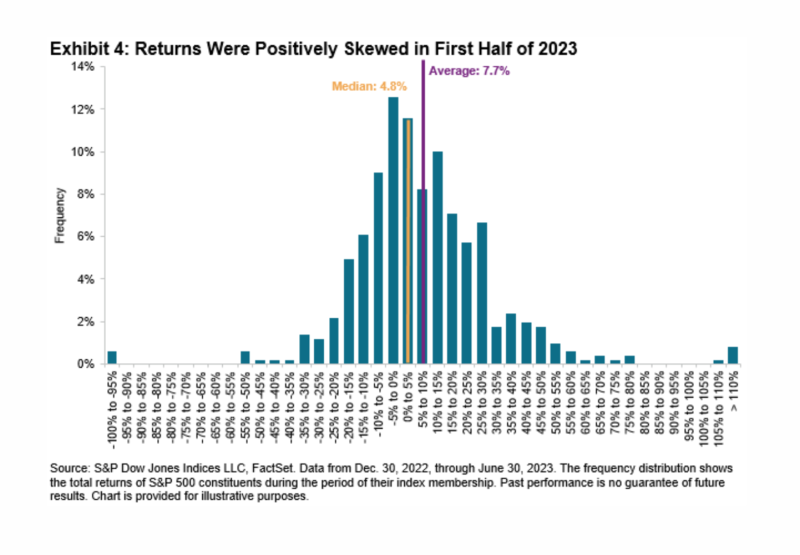
That headwind blows with particular strength in Exhibit 4, which shows the distribution of the performance of the members of the S&P 500 for the first six months of 2023. The median stock in the index rose by 4.8%, while the simple average of all returns was 7.7%. Because the largest stocks in the index were among the best performers, the index’s 16.9% cap-weighted return was well above the simple average. The skewed distribution of returns, and the presence of so many large names on the right tail of the distribution, meant that only 28% of the stocks in the S&P 500 outperformed the index during the first six months.
23e years of SPIVA data have taught us that successful active management is rare. The remarkable performance of the S&P 500’s largest stocks made it particularly difficult in the first half of 2023. If the index’s larger caps continue to outperform, the difficulties faced by active managers are likely to continue.
CRAIG LAZZARA is Managing Director and Global Head of Index Investment Strategy at S&P Dow Jones Indices.
This article was first published on the Indexology blog.
MORE FROM S&P DJI
For more valuable insights from S&P Dow Jones Indices, you might like to read these other recent articles:
How accurate do active predictions need to be?
Active outperformance: Is it luck or skill?
Momentum and high beta: what’s the difference?
WOULD YOU LIKE TO PARTNER WITH US?
Content such as this would not be possible without the support of our strategic partners, to whom we are very grateful.
TEBI’s principal partner in the UK is Sparrows Capital. We also have a strategic partner in Ireland — Biograph Wealth Advisors, a financial planning firm in Dublin.
We are currently seeking partnerships in North America and Australasia with firms that share our evidence-based and client-focused philosophy. If you’re interested in finding out more, do get in touch.
© The Evidence-Based Investor MMXXIII


