
Why index? Simply put, because indexing works. The alternative — active investing — may work, but the overwhelming probability is that it won’t and you would have been better off not taking the chance. A new paper, entitled Shooting the Messenger, by CRAIG LAZZARA and ANU GANTI from S&P Dow Jones Indices is republished here with kind permission. In it the authors set out three main reasons why indexing works. Crucially, they explain, none of those reasons is likely to reverse or even to abate, so the growth of indexing looks set to continue.
“Active investing has been subjected to increasing abuse, particularly by those whose opinions are driven by the persistent accumulation of hard data and logical arguments.”(1)
— Charles D. Ellis
Executive summary
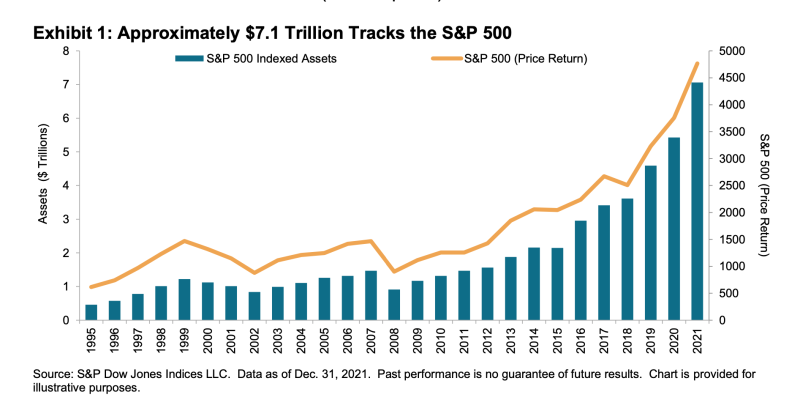
Index funds, which hardly existed 50 years ago, now play a prominent role in global financial markets. Exhibit 1 illustrates the growth of assets tracking the S&P 500, the most prominent index in the world’s largest equity market, but this trend has not been limited to the U.S. (nor to equities).
The growth of indexing has been driven by the inability of active managers, in aggregate, to outperform passive benchmarks. This is not a new development — it was first reported 90 years ago. The rise of passive management is the consequence of active performance shortfalls.
These shortfalls can be attributed to three factors:
— the professionalisation of investment management;
— cost; and
— the skewness of stock returns.
Since each of these factors is likely to persist, the advantage of indexing over active management is likely to persist as well.
Some important observations
Until the early 1970s, there were no index funds; all assets were managed actively. The subsequent shift of assets from active to passive management, as illustrated in Exhibit 1, surely must count as one of the most important developments in modern financial history. Our intent in this paper is to suggest why this transformation came about; the answer, in our view, lies both in a set of observations and in the subsequent explanation of those observations.
The observations to which we refer are designed to document the degree to which active managers are able to add value to the performance of passive benchmarks. The earliest study of active management of which we’re aware dates to 1932. Alfred Cowles examined the stock selection records of both financial services and fire insurance companies (what we would today call property and casualty insurers). Both sets of forecasters underperformed the average common stock during the period Cowles examined. The same was true of a number of financial publications that made predictions of the overall level of the stock market. For all these cases, “statistical tests… failed to demonstrate that they exhibited skill, and indicated that they more probably were [the] results of chance.”(2)
40 years later, by the 1970s, financial markets had grown dramatically as professionals, rather than the retail investors of Cowles’ day, had come to dominate asset management and trading. The growth of professional investment management led to the formation of a number of performance measurement services. Their verdict, by mid-decade, was ominous: “Disagreeable data are streaming out of the computers of Becker securities and Merrill Lynch and all the other performance measurement firms. Over and over and over again, these facts and figures inform us that investment managers are failing to perform. Not only are the nation’s leading portfolio managers failing to produce positive absolute rates of return…but they are also failing to produce positive relative rates of return. Contrary to their oft articulated goal of outperforming the market averages, investment managers are not beating the market: The market is beating them.” (3)
Nobel laureate Paul Samuelson suggested in 1974 that “some large foundation should set up an in-house portfolio that tracks the S&P 500 Index — if only for the purpose of setting up a naïve model against which their in-house gunslingers can measure their prowess.”(5) Samuelson’s evaluation of active management was acerbic: “…Most portfolio decision makers should go out of business — take up plumbing, teach Greek, or help produce the annual GNP by serving as corporate executives.”
Samuelson’s wish for an S&P 500 index fund was granted, more rapidly than he expected, as index funds became available, even to retail investors, in the 1970s.6 Although many things have changed in the intervening 50 years, the performance data that animated Ellis, Malkiel, and Samuelson have been remarkably robust. Our firm’s SPIVA® reports have documented the performance of U.S. managers since 2001 (with shorter histories for other markets), and the results have been almost uniformly discouraging for the advocates of active management. Exhibit 2 illustrates the most recent update.(7)
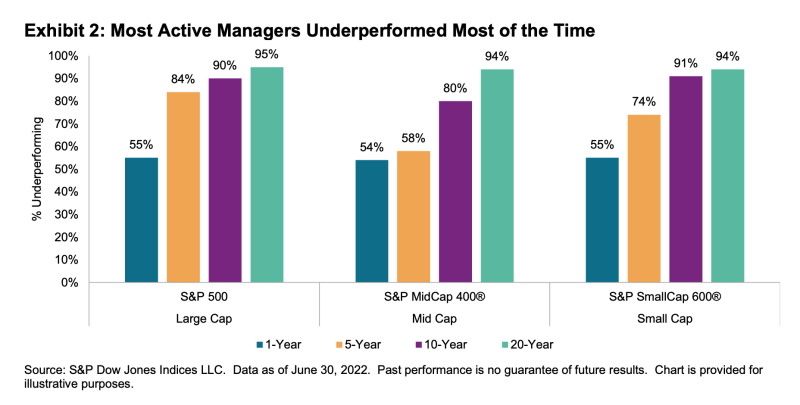
Most active funds underperformed benchmarks appropriate to their investment style. This is not unusual — in fact, over the history of the SPIVA database, underperformance is far more common than not. Moreover, extending the time horizon makes active management look worse, not better. This is consistent with the view that the true odds of outperformance are less than even. Consider: if the likelihood of outperformance were greater than 50%, we would expect to see fluctuations above and below 50% over short periods, but over time we would expect to see more outperformers than underperformers. In fact, we observe the opposite.
This effect is analogous to the roulette wheel in a casino. A lucky player may win on a small number of spins, but over many spins, the house’s advantage is insurmountable. The data suggest that an active equity manager is like a roulette player—he has a small probability of winning in the short run, but an overwhelming probability of losing in the long run.(8)
Moreover, it’s notable that active managers of mid- and small-cap portfolios have had just as much difficulty as their large-cap peers. This is not an intuitive conclusion; in fact it’s sometimes argued that investors should index large-cap, well-researched, relatively “efficient” stocks and use active managers in the less well-covered mid- and small-cap arenas. At first blush, this is plausible, and it’s certainly true that research coverage is tilted toward larger companies. However, the scarcity of research coverage implies only that the likelihood of misvaluation is higher among smaller companies. There’s no reason to assume that the likelihood of undervaluation is higher, and it’s the assumption of undervaluation that’s critical to the argument for active management of smaller stocks.
We would argue, in fact, that overvaluation is at least as likely as undervaluation among smaller names. A manager who thinks he sees undervaluation can readily take advantage of it by buying the undervalued stock. A manager who thinks he sees overvaluation can sell his position down to zero. After that, he’s helpless — unless he wants to borrow stock in order to short it. However, smaller names can often be quite difficult (or expensive) to borrow. This implies that small-cap overvaluation is likely to be more persistent than undervaluation; it’s simply harder to get rid of it.(9)
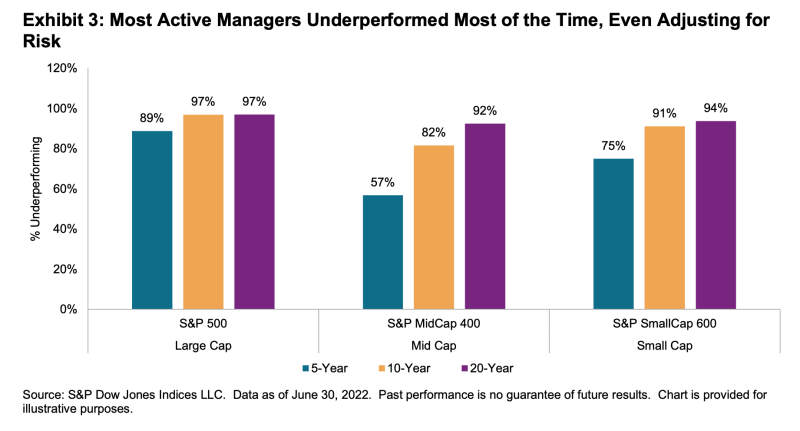
Active managers sometimes argue that even if they are unsuccessful in outperforming indices, they nonetheless benefit their clients by managing portfolio volatility and therefore improving risk-adjusted returns. In general, this premise is incorrect — most active portfolios are more volatile than the benchmarks against which they’re compared.(10) SPIVA data on risk-adjusted performance are therefore comparably grim, as Exhibit 3 shows.
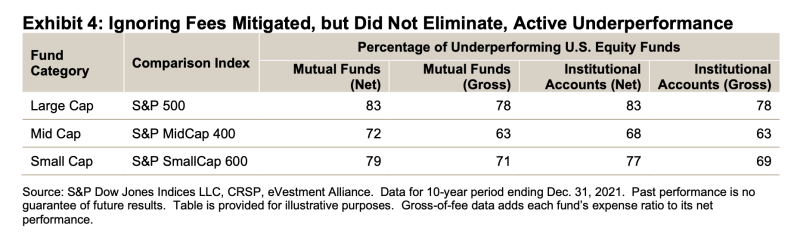
The SPIVA database focuses on mutual funds, net of fees, and critics sometimes argue that manager underperformance is entirely due to fee levels. It’s also fair to observe that institutional asset owners have substantial bargaining power, resulting in lower fees and potentially better performance outcomes than mutual fund investors realise. These objections are accurate, but not decisive. Even ignoring fees altogether, Exhibit 4 shows that the majority of active managers still underperformed.(11)
If most active managers underperform, it’s nonetheless theoretically possible that some managers can be consistently above average. Despite his cynicism, Samuelson acknowledged as much: “People differ in their heights, pulchritude, and acidity. Why not their P.Q. or performance quotient?”(12)
When an active manager beats his benchmark, how can we tell whether that result is a product of genuine skill or merely of good luck? One answer is that genuine skill is likely to persist, while luck is random and soon dissipates. Therefore one key measure of active management skill is the consistency of a fund’s outperformance. SPIVA data let us test for this possibility in a number of ways.(13) Exhibit 5 uses ten years of SPIVA history. We sorted managers into quartiles based on the first five years’ performance, and then examined quartile rankings for the second five years.
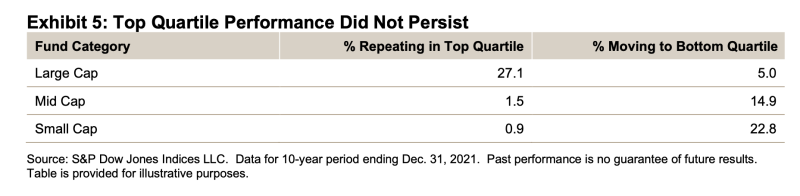
If performance were completely random, we’d expect 25% of the top-quartile managers from the first five years to be in the top quartile for the second five years. That’s more or less what happened for large-cap managers, but their mid- and small-cap counterparts fell well short of the mark. Indeed, mid- and small-cap top-quartile managers were more likely to move to the bottom quartile than they were to remain at the top.(14)
The evidence, over many years, is clear:
— Most active managers underperform most of the time.
— Outperformance, when it occurs, tends not to persist.
These facts cry out for an explanation! Active managers are smart people, they’re well educated, they work hard, and they’re motivated (financially and otherwise) to a fault. Despite all that, why do they fail more often than they succeed?
The explanation: why indexing works
The most important thing to realise about SPIVA (and related) results is that they are not a coincidence. Active underperformance happens for a set of readily identifiable reasons, of which we’ll mention three: professionalisation, cost, and skewness.
The professionalisation of investment management
Investment management is a zero-sum game. There is no natural source of outperformance, or “alpha;” the only source of outperformance for above-average investors is the underperformance of below-average investors. “Investors” in this sense encompass not just professional money managers, but any owner of securities. These owners may well be undiversified owners of concentrated positions who are not aware that they’re in a zero-sum game. Indeed, they may not be aware that there’s a game at all.
For example, imagine a conservative retail investor who owns a few high-quality, dividend- paying electric utility companies because she values their relatively secure income stream. Such an investor is a potential source of alpha for every professional manager who is underweight utilities. Similarly, every corporate executive who owns a concentrated position in his own company’s stock is a potential source of alpha for every professional manager who is underweight that industry or company. If professional investors represent a relatively small fraction of a market’s assets, such undiversified amateurs can be an important source of the professionals’ outperformance. The outperformance garnered by professionals, in other words, could be provided by the underperformance of amateurs.(15)
However, if professionals become the dominant force in a market and amateur investors become relatively less important, the game changes — the professionals are now competing against each other. In the U.S., professionals had come to dominate by the mid-1970s, as Ellis’ 1975 assessment makes clear: “Gifted, determined, ambitious professionals have come into investment management in such large numbers during the past 30 years that it may no longer be feasible for any of them to profit from the errors of all the others sufficiently often and by sufficient magnitude to beat the market averages.(16) This is why indexing began in the 1970s — not 20 years sooner or 20 years later.
It’s important in this discussion to distinguish between absolute and relative skill. Absolute skill in active investing requires managers to access information and to form, based on some combination of fundamental, technical, and quantitative metrics, an assessment of the difference between a stock’s current price and its true value. To criticise active managers’ performance is by no means to impugn the absolute level of their skill.(17) But managers don’t operate in a vacuum. Absolute skill may be necessary for success as an active manager, but it is not sufficient. It’s relative skill that determines outperformance and underperformance.18 It’s not enough to be good at valuing companies; a successful active manager has to be better than his competitors.
If investment management is not unique in this respect, it at least is highly unusual. An average physician may be able to cure most illnesses, and an average lawyer may be a perfectly adequate source of legal representation for most needs.19 However, investment management is different: an average investment manager is of no value at all. “Investing is unusual, in that the collective judgement of all the participants (weighted by the amount of money they control) is… available for free… If a professional investor is to earn excess returns for his client, being good is insufficient — he must be exceptional.(20)
The difficulty is compounded when we consider what happens when assets move from active managers to index funds. Presumably, the least capable active managers lose the most assets. This means that the quality of the surviving active managers rises as assets move to passive alternatives, making the competition for outperformance tougher.(21) Active managers thus find it increasingly difficult to stay above average as index funds cull the weakest competitors.(22)
Cost
Low cost is the simplest explanation for the success of passive management. Imagine a market in which all assets are actively managed, and into which a passive alternative, deus ex machina, is inserted. This passive alternative buys a pro-rata slice of every company in the market. Since the passive portfolio owns a pro-rata share of every stock’s capitalisation, its portfolio will be identical to the aggregate portfolio of the active managers. Before costs, therefore, the passive and active portfolios will have the same return.
However, active managers’ costs — for research, trading, management fees, etc. — are inherently higher than those of passive managers. Thus, “properly measured, the average actively managed dollar must underperform the average passively managed dollar, net of costs. Empirical analyses that appear to refute this principle are guilty of improper measurement.”(23)
To illustrate the importance of costs, consider that the average expense ratio for active U.S. equity mutual fund managers in 2021 was 0.68%, compared to only 0.06% for their passive competitors.(24) This difference of 62 bps offers investors an automatic advantage for choosing a passive manager versus an active one. The growing popularity of index funds, along with industry consolidation and economies of scale, has the potential to lower the costs of passive vehicles further.
Skewness
In a normal distribution, observations array symmetrically around their average value. The cross-sectional distribution of stock returns is not normal, but rather is positively skewed—i.e., the average value is typically greater than the median. We might suspect that there is a natural tendency toward skewed equity returns since a stock can only go down by 100%, while it can appreciate by much more than that. Large positive values can pull the average level of the distribution above its midpoint.
We observe this in Exhibit 6, which plots the distribution of cumulative returns for the constituent stocks of the S&P 500 for the past 20 years. The median return was 88%, far less than the arithmetic average of 358%. Importantly, the positive skew in equity returns illustrated by the exhibit is not simply an artefact of a small number of highly skewed years: in the 31 years between 1991 and 2021, the average S&P 500 stock outperformed the median 27 times.(25)
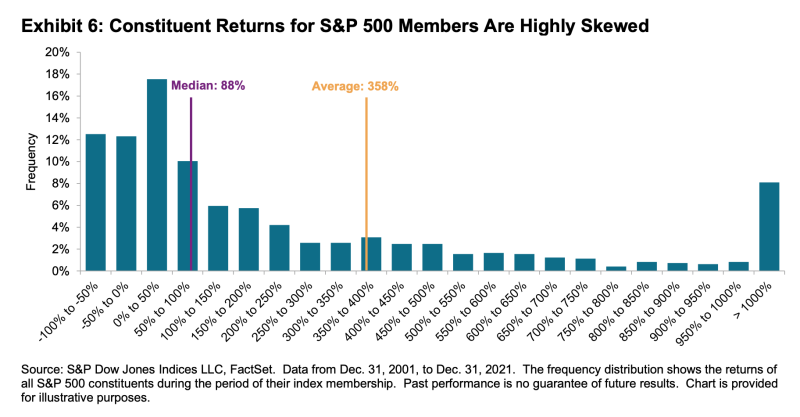
If stock returns were normally distributed, a randomly chosen stock would have an even chance of delivering above-average performance. When the distribution is skewed, selection becomes much harder. Of the 975 stocks that were constituents of the S&P 500 at some point between 2002 and 2021, only 253 beat the average. The probability that a randomly chosen stock would deliver above-average performance, in other words, was 26%, not 50%. When fewer stocks outperform, active management is harder.
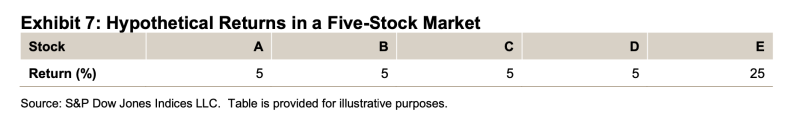
Active managers compound the natural challenges of skewed returns by their tendency to run relatively concentrated portfolios.(26) Exhibit 7 is a simple example of clearly skewed returns; we posit a market with five stocks, one of which dramatically outperforms the others.27 We assume that at the beginning of the year, the stocks’ capitalisations are identical, so that the market’s return is 9%, driven by the outstanding performance of stock E.
We can form portfolios of various sizes from these five stocks, as shown in Exhibit 8. For example, since there are five stocks, there are five possible one-stock portfolios. Four of them underperform the market as a whole. Similarly, there are also five possible four-stock portfolios, four of which outperform the market as a whole. Since the market, on our assumptions, is up 9%, the average return of the portfolios is always 9%—if the market gives us 9%, it doesn’t matter how we divide it. What changes is the distribution of returns across portfolios. Holding more stocks increases the likelihood of outperformance.(28)
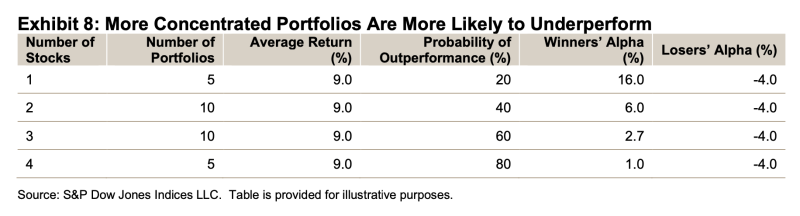
The intuition here is simple: a manager’s picks are more likely to underperform than to outperform simply because there are more underperformers than outperformers from which to choose.(29) If returns are positively skewed, more concentrated portfolios are less likely to hold one of the relatively small number of outperforming stocks.
Market efficiency
Notice that we have not mentioned the notion of “market efficiency”. Nobel laureate Eugene Fama defined the term as “a market in which prices always ‘fully reflect’ available information.(30) Obviously, if markets fully reflect available information, market prices will reflect true value, which makes security selection pointless. The challenge for advocates of the efficient markets hypothesis is that it’s easy to find ex post evidence of times when value and price did not correspond — for example, during the technology bubble of the late 1990s. But while the assumption of efficiency may be sufficient to make the case for index funds, the assumption is not necessary. Even if we acknowledge that prices may not always reflect fair value, the factors we’ve identified — professionalisation, cost, and skewness — will continue to challenge active managers relentlessly.
The challenge is relentless because the factors which account for underperformance are robust and sustainable. Investment management will stay professionalized, active costs will always exceed index costs, and, in most years, most stocks underperform the average return in most markets.
Where are we now?
Estimating the extent to which U.S. asset owners have adopted passive management can be an arduous and frustrating task. Calculating the market share of passive assets under management requires us to get both the numerator (passive AUM) and denominator (total market capitalisation) correct, and much commentary is mistaken about one or both. Moreover, since data on exchange-traded and mutual funds are relatively easy to find, other pools of assets are sometimes ignored as they are not publicly reported.(31)
We can, of course, make a reasonably accurate estimate of assets tracking our own indices.(32) At the end of 2021, approximately $7.1 trillion was indexed to the S&P 500; those assets account for 17% of the S&P 500’s float-adjusted market capitalisation.(33) But 17% obviously understates the importance of indexing, since most of the stocks in the S&P 500 are also included in our competitors’ large-cap U.S. indices.
A recent attempt to gauge the size of the passive market using trading data around index changes resulted in an “estimate that passive investors held at least 37.8% of the U.S stock market.”(34) While a useful contrast to our own work, this estimate assumes that every trader at the close on an index reconstitution day is a “strict end-of-day indexer;” in fact some such trading may come from active funds proactively managing their tracking error.
If we assume that the correct answer is certainly higher than 17% but probably lower than 38%, we can justify an estimate that approximately 25%-35% of total float-adjusted U.S. market capitalisation is held by passive index trackers.(35) More precision is probably impossible, and we at least can stand on the principle that “it is better to be roughly right than exactly wrong.”(36)
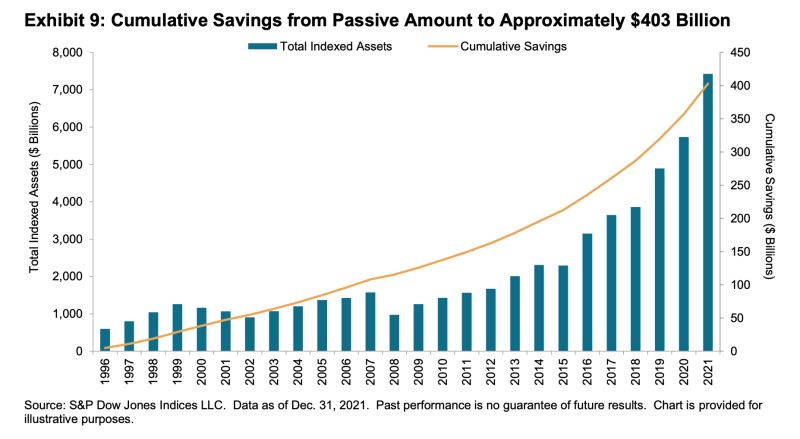
In Exhibit 9, we use data from our own indices to estimate the cumulative savings that investors have achieved from passive investing. At the end of 2021, approximately $7.4 trillion tracked the S&P 500, S&P 400, and S&P 600. We previously noted the 62 bps current fee differential between active and passive U.S. mutual fund managers, and historically the gap has been much higher.(37) Multiplying the current fee differential by $7.1 trillion tells us that passive management, for the S&P 500 alone, saves investors $43.8 billion annually. Cumulatively, and across the large-, mid-, and small-cap spaces, the savings amount to $403 billion over the past 26 years.(38)
It would, of course, be penny wise and pound foolish for investors to save a few basis points on management fees if those savings caused them to miss an even larger increment of active performance, but as we’ve already seen, it isn’t because they don’t. These savings accrue entirely to the benefit of index fund investors.
Final thoughts
50 years ago, index funds amounted to a negligible share of the equity market. Edward Johnson of Fidelity spoke for most active managers of that time when he said (criticising the nascent Vanguard), “I can’t believe that the great mass of investors are going to be satisfied with receiving just average returns.”(39) Ironically, of course, above-average returns are exactly what index investors have received — and what most active investors have missed.
If active managers had delivered above-average performance, the index fund would not have been invented, and the passive investment industry would not exist today. Evidence of active underperformance is nearly a century old, and we’ve suggested some of the reasons — professionalisation, cost, and skewness — that explain it. Since these reasons seem unlikely to reverse or even to abate, it’s likely that the growth of indexing will continue.
The shift to index funds, in other words, has been and continues to be driven by the persistent underperformance of active managers. To argue otherwise is to misunderstand the most important thing about it.
Footnotes
1 Ellis, Charles D., “In Defense of Active Investing,” Financial Analysts Journal, July/August 2015.
2 Cowles 3rd, Alfred, “Can Stock Market Forecasters Forecast?” Econometrica, July 1933. See also Edwards, Tim, “Eighty-one years later…,” S&P Dow Jones Indices, Dec. 19, 2013.
3 Ellis, Charles D., “The Loser’s Game,” Financial Analysts Journal, July/August 1975. Emphasis added.
4 Malkiel, Burton G., A Random Walk Down Wall Street, first edition, 1973, p. 226.
5 Samuelson, Paul A., “Challenge to judgment,” Journal of Portfolio Management, Fall 1974. Interestingly, John Bogle credited this article with inspiring him to start the first index mutual fund at Vanguard in 1976.
6 Bogle, John C., “The Professor, the Student, and the Index Fund,” Sept. 6, 2011.
7 Edwards, Tim et al., “SPIVA U.S. Mid-Year 2022 Scorecard,” S&P Dow Jones Indices, September 2022.
8 Readers who prefer basketball to roulette should consult Lazzara, Craig, “Shooting Hoops with Michael Jordan: An Allegory,” S&P Dow Jones Indices, Sept. 29, 2022.
9 While there’s little evidence of stock selection skill within the mid- and small-cap universe, rotation across capitalisation segments can sometimes improve active results. For example, if a manager benchmarked against the S&P 500 tilts toward mid caps in a year when mid caps outperform, his results might benefit from that tilt. See Ganti, Anu R. and Craig J. Lazzara, “Style Bias and Active Performance,” S&P Dow Jones Indices, March 2021.
10 Edwards, Tim, Craig J. Lazzara, and Luca Ramotti, “The Volatility of Active Management,” S&P Dow Jones Indices, September 2016.
11 Edwards, Tim et al.,“SPIVA Institutional Scorecard Year-End 2021, S&P Dow Jones Indices, September 2022. 12 Samuelson, op. cit.,p19.
13 Liu, Berlinda, “U.S. Persistence Scorecard Year-end 2021,” S&P Dow Jones Indices, April 2022.
14 See also Lazzara, Craig,“Getting What You PayFor,” S&P Dow Jones Indices, Oct. 27, 2017.
15 Mauboussin, Michael J. and Dan Callahan,“Alpha and the Paradox of Skill,” Credit Suisse, July15, 2013, p.7.
16 Ellis (1975), op. cit., p.19.
17 See Pastor, Lubos, Robert F. Stambaugh, and Lucian A. Taylor,“Scale and Skill in Active Management,”February2014.
18 Swedroe, Larry, “Has The Rise of Indexing Made Active Outperformance Even Harder?,”TheEvidence-BasedInvestor,October2022.
19 Indeed, below-average physicians and lawyers may still be sources of considerable value to their clients.
20 Arbit, Hal, “The Nature of the Game,” Journal of Portfolio Management,” Fall 1981, pp. 5-9. Emphasis added.
21 Huang, Da,“Passive Investing, Mutual Fund Skill, and Market Efficiency,” August 2022.
22 An analogy of which we’re fond: The lion catches the slowest zebra in the herd. After that, the speed of the herd goes up. It will be more challenging for the surviving zebras to be above average tomorrow. Mutatis mutandis, the same principle applies to active managers.
23 Sharpe, WilliamF.,“ The Arithmetic of Active Management,” FinancialAnalystsJournal,” January/February 1991, p.7-9.
24 Investment Company Institute, 2022 Investment Company FactBook, p.107.
25 We find similar results in other markets. The average stock outperformed the median in 19 of the last 24 years for the S&P/TSX Composite, 14 of 21 years for the S&P Europe 350®, 25 of 26 years for the S&P/TOPIX 150, 13 of 21 years for the S&P/ASX 200, and 25 of 25 years for the S&P Pan Asia ex-Japan BMI. For a longer-term perspective, see Bessembinder, Hendrik, “Do Stocks Outperform Treasury Bills?,” November 2017.
26 Edwards, Tim and Craig J. Lazzara, “Fooled by Conviction,” S&P Dow Jones Indices, July 2016.
27 This example is drawn from Heaton, J.B., Nick Polson, and Jan Hendrik Witte “Why Indexing Works,” October 2015.
28 See also Livnat, Joshua, Gavin Smith, and Martin B. Tarlie “Modified IRAs a Predictor of Fund Performance,” October 2015, for evidence that among comparably skilful active managers, greater diversification is an indicator of better future performance.
29 The challenge for stock pickers is exacerbated when the outperformers include the largest stocks in the index. See Chan, Fei Mei and Craig J. Lazzara, “Degrees of Difficulty: Indications of Active Success,” S&P Dow Jones Indices, January 2022, pp. 8-9.
30 Fama, Eugene F., “Efficient Capital Markets: A Review of Theory and Empirical Work,” Journal of Finance, May 1970, pp. 383-417.
31 See ,e.g. Ganti, Anu,“Don’t Shoot the Messenger,”S&P Dow Jones Indices, Sept.27, 2017.
32 S&P Dow Jones Indices Annual Survey of Assets as of Dec. 31, 2021.
33 Ganti,Anu,“The Importance of Being Indexed,”S&P Dow Jones Indices, October 2022.
34 Chinco, Alex and Marco Sammon,“ The Passive Ownership Share Is Double What You Think It Is,”September 2022.
35 Wigglesworth, Robin,“How passive are markets, actually?,”Financial Times, Sept.4, 2022.
36 This sentiment is often attributed to Lord Keynes, but in fact originated with his older contemporary Carveth Read in Logic: Deductive and Inductive, 1898.
37 Investment Company Institute, op. cit., p. 107.
38 Ganti, Anu, “The Importance of Being Indexed,” op. cit.
39 Swedroe, Larry,“Passive Investing Won’t Break Market,” Sept. 6, 2016.
Disclaimer
© 2022 S&P Dow Jones Indices. All rights reserved. S&P, S&P 500, SPX, SPY, The 500, US500 , US 30, S&P 100, S&P COMPOSITE 1500, S&P 400, S&P MIDCAP 400, S&P 600, S&P SMALLCAP 600, S&P GIVI, GLOBAL TITANS, DIVIDEND ARISTOCRATS, Select Sector, S&P MAESTRO, S&P PRISM, S&P STRIDE, GICS, SPIVA, SPDR, INDEXOLOGY, iTraxx, iBoxx, ABX, ADBI, CDX, CMBX, MBX, MCDX, PRIMEX, HHPI and SOVX are trademarks of S&P Global, Inc. (“S&P Global”) or its affiliates. DOW JONES, DJIA, THE DOW and DOW JONES INDUSTRIAL AVERAGE are trademarks of Dow Jones Trademark Holdings LLC (“Dow Jones”). These trademarks together with others have been licensed to S&P Dow Jones Indices LLC. Redistribution or reproduction in whole or in part are prohibited without written permission of S&P Dow Jones Indices LLC. This document does not constitute an offer of services in jurisdictions where S&P Dow Jones Indices LLC, S&P Global, Dow Jones or their respective affiliates (collectively “S&P Dow Jones Indices”) do not have the necessary licenses. Except for certain custom index calculation services, all information provided by S&P Dow Jones Indices is impersonal and not tailored to the needs of any person, entity or group of persons. S&P Dow Jones Indices receives compensation in connection with licensing its indices to third parties and providing custom calculation services. Past performance of an index is not an indication or guarantee of future results.
It is not possible to invest directly in an index. Exposure to an asset class represented by an index may be available through investable instruments based on that index. S&P Dow Jones Indices does not sponsor, endorse, sell, promote or manage any investment fund or other investment vehicle that is offered by third parties and that seeks to provide an investment return based on the performance of any index. S&P Dow Jones Indices makes no assurance that investment products based on the index will accurately track index performance or provide positive investment returns. S&P Dow Jones Indices LLC is not an investment advisor, and S&P Dow Jones Indices makes no representation regarding the advisability of investing in any such investment fund or other investment vehicle. A decision to invest in any such investment fund or other investment vehicle should not be made in reliance on any of the statements set forth in this document. S&P Dow Jones Indices is not an investment adviser, commodity trading advisor, commodity pool operator, broker dealer, fiduciary, promoter” (as defined in the Investment Company Act of 1940, as amended), “expert” as enumerated within 15 U.S.C. § 77k(a) or tax advisor. Inclusion of a security, commodity, crypto currency or other asset within an index is not a recommendation by S&P Dow Jones Indices to buy, sell, or hold such security, commodity, crypto currency or other asset, nor is it considered to be investment advice or commodity trading advice. Closing prices for S&P Dow Jones Indices’ US benchmark indices are calculated by S&P Dow Jones Indices based on the closing price of the individual constituents of the index as set by their primary exchange. Closing prices are received by S&P Dow Jones Indices from one of its third party vendors and verified by comparing them with prices from an alternative vendor. The vendors receive the closing price from the primary exchanges. Real-time intraday prices are calculated similarly without a second verification.
These materials have been prepared solely for informational purposes based upon information generally available to the public and from sources believed to be reliable. No content contained in these materials (including index data, ratings, credit-related analyses and data, research, valuations, model, software or other application or output therefrom) or any part thereof (“Content”) may be modified, reverse- engineered, reproduced or distributed in any form or by any means, or stored in a database or retrieval system, without the prior written permission of S&P Dow Jones Indices. The Content shall not be used for any unlawful or unauthorized purposes. S&P Dow Jones Indices and its third-party data providers and licensors (collectively “S&P Dow Jones Indices Parties”) do not guarantee the accuracy, completeness, timeliness or availability of the Content. S&P Dow Jones Indices Parties are not responsible for any errors or omissions, regardless of the cause, for the results obtained from the use of the Content. THE CONTENT IS PROVIDED ON AN “AS IS” BASIS. S&P DOW JONES INDICES PARTIES DISCLAIM ANY AND ALL EXPRESS OR IMPLIED WARRANTIES, INCLUDING, BUT NOT LIMITED TO, ANY WARRANTIES OF MERCHANTABILITY OR FITNESS FOR A PARTICULAR PURPOSE OR USE, FREEDOM FROM BUGS, SOFTWARE ERRORS OR DEFECTS, THAT THE CONTENT’S FUNCTIONING WILL BE UNINTERRUPTED OR THAT THE CONTENT WILL OPERATE WITH ANY SOFTWARE OR HARDWARE CONFIGURATION. In no event shall S&P Dow Jones Indices Parties be liable to any party for any direct, indirect, incidental, exemplary, compensatory, punitive, special or consequential damages, costs, expenses, legal fees, or losses (including, without limitation, lost income or lost profits and opportunity costs) in connection with any use of the Content even if advised of the possibility of such damages.
S&P Global keeps certain activities of its various divisions and business units separate from each other in order to preserve the independence and objectivity of their respective activities. As a result, certain divisions and business units of S&P Global may have information that is not available to other business units. S&P Global has established policies and procedures to maintain the confidentiality of certain non-public information received in connection with each analytical process.
In addition, S&P Dow Jones Indices provides a wide range of services to, or relating to, many organizations, including issuers of securities, investment advisers, broker-dealers, investment banks, other financial institutions and financial intermediaries, and accordingly may receive fees or other economic benefits from those organizations, including organizations whose securities or services they may recommend, rate, include in model portfolios, evaluate or otherwise address.
PREVIOUSLY ON TEBI
Financial context is everything
Should you still invest in bonds?
Is the growth of passive investing messing with markets?
CONTENT FOR ADVICE FIRMS
Through our partners at Regis Media, TEBI provides a wide range of high-quality content for financial advice and planning firms. The material is designed to help educate clients and to engage with prospects.
As well as exclusive content, we also offer pre-produced videos, eGuides and articles which explain how investing works and the valuable role that a good financial adviser can play.
If you would like to find out more, why not visit the Regis Media website and YouTube channel? If you have any specific enquiries, email Robin Powell, who will be happy to help you.
© The Evidence-Based Investor MMXXII


