Robin writes:
The dot-com crash of the late 1990s was a chastening experience for me. I was a pretty clueless investor in those days and an avid reader of the money sections in the weekend papers. The smart money, we were told, was in dot-coms. The prices of internet-related firms rose sharply, and investors who hadn’t jumped on board the bandwagon were made to feel they were missing out. Yet a large proportion of these companies hadn’t even made a profit. In the crash that followed, huge numbers of investors, me included, lost out.
Thankfully, I now know better. But as LARRY SWEDROE explains, many investors — professional ones included — fail to learn the lessons that episodes like the dot-com crash can teach us. The rise and fall in tech stock prices in recent years, he says, is almost a re-run of what happened in the late 1990s. Investors will always be lured by the promise of “disruptive technologies”, but it’s a dangerous trap.
Legendary investor John Templeton famously warned investors that the four most dangerous words were “this time it’s different.” As the chief research officer of Buckingham Wealth Partners, I have been frequently asked about the spectacular performance and very high valuations of disruptive technology stocks (like those favoured by Cathie Wood and her ARK Innovation ETF, ARKK) and meme stocks (stocks with large followings on social media platforms such as Reddit that also have large short positions and limited liquidity) and whether this time is really different.
To answer that question, I’ll begin by noting that one of my favorite expressions is “What you don’t know about investing is the investment history you don’t know.” We’ll use our trusty videotape machine and return to the late 1990s to see if we can determine if this time it’s really different or if we have already been there and done that.
The late 1990s, which included what has become known as the “tech bubble” or the “dot-com bubble”, witnessed the Nasdaq Index rise 400 percent between 1995 and its peak in March 2000 only to fall 78 percent from its peak by October 2002, giving up all its gains. The period was characterised by investors speculating on IPOs and stocks of companies with high price to value metrics (such as book-to-market and price-to-earnings); low, if any, earnings; high investment; and stocks with lots of buzz in the social media because they were “disruptive technologies”.
History repeats, investors don’t learn
The last few years were a virtual repeat of the technology bubble that culminated in the do-com crash. We have not only seen increased speculation on IPOs but on even more speculative special purpose acquisition companies (SPACs). (See my article on SPACs here.) The late 90s also witnessed a burst of retail trading through low-cost online brokerages such as E-trade, with their humorous commercials. Today, even lower cost and more accessible stock trading is available through apps on mobile devices. And just as in the late 90s, stock market valuations are at, or near, historic highs (with the CAPE 10 approaching peak valuations), and a few mega-cap stocks comprise a large share of the S&P 500 index —as I write this, Apple and Microsoft alone make up more than 11 percent of the S&P 500 Index.
At the end of 1999, the top ten stocks by market cap were Microsoft, GE, Cisco, Exxon, Walmart, Intel, NTT, Lucent, Nokia and BP, several of which certainly qualified as the disruptors of their day. With that in mind, let’s look back at Clayton Christensen’s 1997 book, The Innovator’s Dilemma. Amazon’s website review stated that the book shows how such products as the Honda Super Cub, Intel’s 8088 microprocessor and hydraulic excavators were disruptive technologies that helped redefine the competitive landscape of their respective markets. The review stated: “These products did not come about as the result of successful companies carrying out sound business practices in established markets. … These and other products cut into the low end of the marketplace and eventually evolved to displace high-end competitors and their reigning technologies.” Amazon’s review highly recommended this important book.
According to BusinessWeek (June 25, 2001), Clayton Christensen was not only a Harvard Business School professor, he was also a “management guru”, a “rising star of the new economy” and “the most innovative business thinker in the world today.” In March 2000 Mr Christensen, along with St. Louis brokerage owner Neil Eisner, opened the Disruptive Growth Fund. Given his reputation, the financial world and investors had great expectations for the fund.
Christensen chose stocks based on his theory that companies that develop innovative products — disruptive technologies — can topple market leaders. Sound like Cathie Wood? How did it turn out? Before reaching even its first anniversary, the fund was liquidated — but not before it had lost 64 percent of its value. The only thing disruptive about the fund was that it disrupted the financial health of its investors. The same thing could be said today about investors who chased the performance of ARKK. After returning 157 percent in 2021, ranking in the first percentile of performers, the fund lost 23 percent in 2021 and another 30 percent through January 27, 2022 — in both cases the fund ranked in the 100th percentile (the worst). Another example of been there, done that.
To provide insight into what might be in store for investors in today’s largest stocks, let’s take a quick look at how the top ten stocks at the end of 1999 performed over the period 2000-2021. While the S&P 500 Index returned 7.5 percent per year, only one of the largest stocks (Microsoft, which returned 10.6 percent) outperformed that benchmark. The other “disrupters” provided the following returns: Cisco, 2.2 percent (and a drawdown of 86 percent during the crash); Intel 3.3, percent; Walmart, 5.3 percent; NTT, 1.5 percent; and Nokia, -6.3 percent. GE lost 3.8 percent a year, while Exxon and BP returned 5.1 percent and 1.1 percent, respectively. Lucent did so poorly that it was eventually merged into Alcatel in 2006, having seen its stock price drop from $75 at the end of 1999 to under $3 at the time of the merger. (Data for stock returns are from the Backtest Portfolio tool at Portfolio Visualizer.) The lessons history teaches are that the prices you pay matter and that disrupters often get disrupted themselves via the process economists refer to as “creative destruction”.
There is one more similarity between today’s markets and the 1990s relating to the relative valuations of growth stocks and value stocks. At the end of 1994, before the “tech bubble” began to inflate, the relative price-to-book market of large growth (0.40) to large value (0.85) stocks was 2.1, and to small value stocks it was 2.3 (0.40 vs. 0.93). By the end of the first quarter of 2000, the ratio had increased to 4.9 (0.21 versus 1.02) for large value and 4.7 (0.21 vs. 0.98) for small value. Similarly, the P/E ratio spreads widened. In 1994, the P/E ratio spread for large growth to large value was 1.5 (15.8 versus 10.3). For large growth to small value, it was 1.35 (15.8 versus 11.7). By the end of the first quarter of 2000, those spreads had increased to 2.6 (29.7 versus 11.3) for large stocks and 2.6 (29.7 versus 11.6) relative to small value stocks. Note that while the valuations of the growth stocks that dominate the major market indices increased dramatically, the valuations of value stocks barely budged — growth stocks became much more expensive, but this was not true for value stocks.
The increase in relative valuations is important because the research demonstrates that the size of the spread contains information on future returns. For example, Avantis examined the historical data over the period 1980-2019. The table below makes clear that the future value premium tends to be much higher following periods when the valuation spread is above the median spread — as it was in 2000.
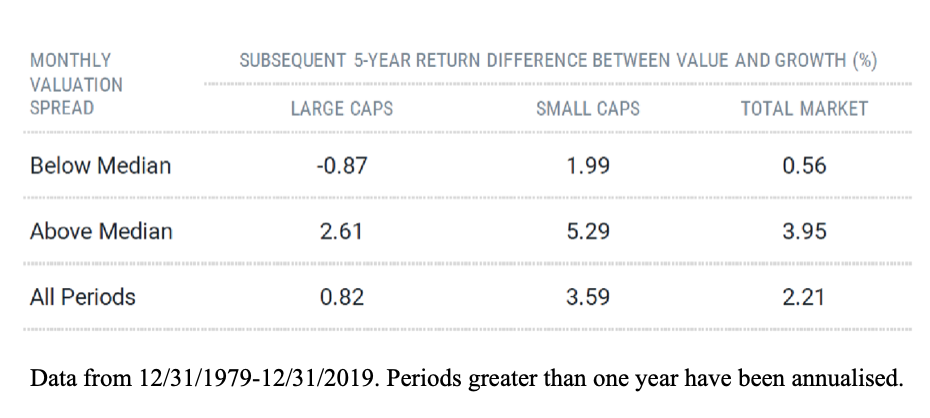
The widening of the relative valuations led to the dramatic outperformance of value stocks over the eight-year period 2000-07. Over this period the Fama-French large value research index outperformed the Fama-French large growth research index by 7.6 percentage points a year (8.0 vs. 0.4), and the Fama-French small value research index outperformed the Fama-French small growth index by 14.6 percentage points per year (15.4 vs. 0.8). Because of recency bias, investors who ignored the long-term evidence and the widening of the valuation spread missed out on that outperformance.
We see the same widening of the relative valuation spread today. For example, in their study, Avantis found that over the period 2010-2019, the book-to-market ratio of large growth stocks had increased 113 percent compared to increases of just 32 percent and 4 percent, respectively, for large and small value stocks. Similar widenings occurred in P/E ratios, as large growth P/Es increased 61 percent compared to a 33 percent increase for large value P/Es and a shrinkage of 1 percent in small value P/Es. That trend continued in 2020 as growth stocks far outperformed once again. We finally saw a reversal of the trend in 2021—while the Russell 1000 Growth Index outperformed the Russell 1000 Value Index by a small margin (27.6 percent versus 25.2 percent), the Russell 2000 Value Index far outperformed the Russell 2000 Growth Index (28.3 percent versus just 2.8 percent). This was the first outperformance of value stocks since 2016. That outperformance continued in the early weeks of 2022. While all crystal balls are cloudy, the evidence demonstrates that the wide spread in valuations today provides information that indicates value stocks should be expected to generate large premiums going forward, larger than the historic value premium—just as they did after the peak in spread in March 2000.
Using Vanguard’s Growth Index Fund (VUG) and Value Index Fund (VTV), we see that at the end of 2021 the P/B ratio was 3.6 (8.9 vs. 2.5)—not quite as wide as the 4.9 spread we saw before the tech bubble burst, but much wider than the 2.1 ratio that existed before that bubble inflated. The same is true of P/Es, with the year-end ratio being 2.2 (34.1 vs. 15.6), not quite as wide as the 2.6 ratio that existed at the end of March 2000, but much wider than the 1.5 ratio that existed at the end of 1994. The same widening occurred in the valuation spreads for small stocks. The bottom line is that we have basically experienced a repeat of the late 1990s, with the valuations of growth stocks dramatically increasing while the valuations of value stocks remain relatively unchanged.
The dot-com crash certainly provided a history lesson for those who paid attention. However, it’s not the only period that has a lot in common with recent times.
Lessons from the Nifty Fifty
In their paper Party Like It’s 1972: What Can the Nifty Fifty Teach Us About Today’s Market?, Bridgeway’s Andrew Berkin and Sri Lakshmanan also noted the similarities between the Nifty Fifty period and today. The term “Nifty Fifty” was an informal designation for a group of roughly 50 large-cap stocks on the New York Stock Exchange in the 1960s and 1970s that were widely regarded as solid buy and hold, profitable, growth stocks — stocks that were considered one-decision stocks that should be bought, but never sold, regardless of how high valuations went.
Berkin and Lakshmanan presented the following chart showing the similarity in performance of the Nifty Fifty and today’s equivalents, the FANMAG (FAANGs are old news) stocks — Facebook, Amazon, Netflix, Microsoft, Apple and Google (now trading as Alphabet). The chart also includes the tech bubble (proxied by the Nasdaq 100). The chart shows ten years of returns, with year five set at the peak calendar years of 1972 and 1999. For FANMAG, year five is 2020.
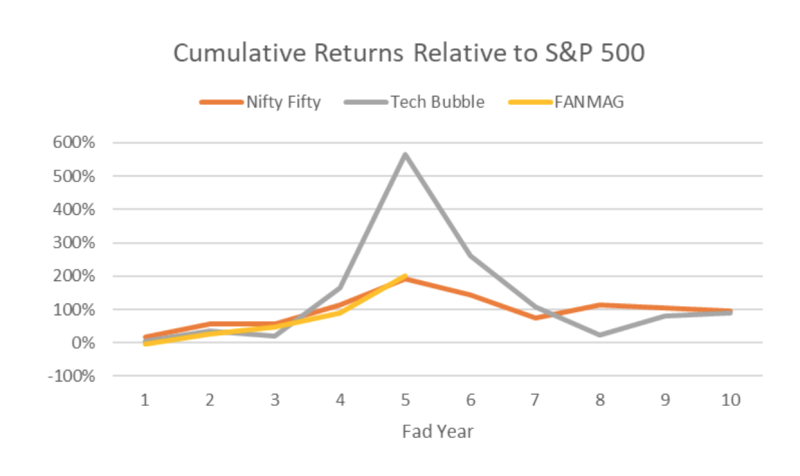
Source: Refinitiv, S&P Global ratings, CRSP, Compustat, Bridgeway calculations
What can we learn from the Nifty Fifty?
Berkin and Lakshmanan noted that there was never a fixed set of 50 companies comprising an “official” Nifty Fifty. In 1998 Jeremy Siegel used 50 stocks identified by Morgan Guaranty Trust to claim that after 25 years their returns justified those valuations. However, in their 2002 study The Nifty-Fifty Re-Revisited, Jeff Fesenmaier and Gary Smith pointed out that because many of the Nifty Fifty stocks had more reasonable P/E ratios and thus might not be truly representative, they also considered a separate list provided by Kidder Peabody. They found that stocks on each list somewhat lagged the S&P 500 over the next 29 years; stocks on both lists underperformed more notably; and stocks with the highest P/E ratios had the lowest returns.
Just like the Nifty Fifty, the FANMAG stocks are great companies that are also considered great stocks — just buy and hold them regardless of price. What can go wrong? Unfortunately, just as investors in the great companies in the Nifty Fifty learned, there’s always something that can go wrong. We just don’t know what it will be — competition, regulatory problems, antitrust issues and other possibilities.
What the FANMAG stocks certainly have in common with the Nifty Fifty of yore are high relative valuations. For example, at the end of 2020, the average P/E for the FANMAG stocks was over 48. Berkin and Lakshmanan noted: “One issue for stocks with high P/E ratios is that subsequent earnings can’t just be good, they have to continue to be great. From the peak of the Nifty Fifty, their earnings still tended to surpass those of the S&P 500. But, they simply weren’t good enough to justify valuations.”
As Berkin and Lakshmanan noted, history provides us with the insight that as a company gets bigger and bigger, growth becomes harder and harder to maintain. And the historical evidence also demonstrates that those stocks with the highest growth expectations tend to lag over the long run, while value stocks tend to outperform. This is the basis for the value premium.
Investor takeaways
History teaches us that just as being smart is not a sufficient condition to outperform the market, being a great company is not sufficient to outperform either — a great company isn’t necessarily the same thing as a great stock. Valuations matter, and they matter a great deal. Studies such as Value Return Predictability Across Asset Classes and Commonalities in Risk Premia, published in the March 2021 issue of the Review of Finance, have found that returns to value strategies are predictable in the time series by their respective value spreads — an increase in the value spread predicts an increase in expected value return. That knowledge can help you avoid the mistake of recency bias.
It is also important to remember that while investor sentiment has driven the valuations of growth stocks to historically high levels, the valuations of value stocks have not changed very much despite the fact that interest rates are at historic lows. In other words, while “the market” (as represented by the S&P 500 Index) is highly valued, forecasting low future returns, this is not the case for value stocks.
For example, as I write this on January 27, 2022, while the current P/E of Vanguard’s 500 Index Fund (VFINX) is 21.8, the P/E of Bridgeway’s Omni Small-Cap Value Fund (BOSVX) is just 9.3, the P/E of Dimensional’s U.S. Small-Cap Value Fund (DFSVX) is just 10.0, and the P/E of Avantis’ U.S. Small-Cap Value Fund (AVUVX) is just 9.4 (Buckingham Strategic Wealth recommends these three funds for inclusion in portfolios).
The other lesson is that the creative destruction process of capitalism means today’s leaders rarely persist over multiple decades. So is it different this time? Or have we been there and done that? You decide.
For informational and educational purposes only and should not be construed as specific investment, accounting, legal, or tax advice. Certain information is based upon third party data which may become outdated or otherwise superseded without notice. Third party information is deemed to be reliable, however its accuracy and completeness cannot be guaranteed. Mentions of specific securities are for illustrative purposes only and should not be construed as a recommendation of shown securities. By clicking on any of the links above, you acknowledge that they are solely for your convenience, and do not necessarily imply any affiliations, sponsorships, endorsements or representations whatsoever by us regarding third-party websites. We are not responsible for the content, availability or privacy policies of these sites, and shall not be responsible or liable for any information, opinions, advice, products or services available on or through them. The opinions expressed by featured authors are their own and may not accurately reflect those of the Buckingham Strategic Wealth® or Buckingham Strategic Partners®, collectively Buckingham Wealth Partners. Neither the Securities and Exchange Commission (SEC) nor any other federal or state agency have approved, determined the accuracy, or confirmed the accuracy of this article. LSR-22-231
LARRY SWEDROE is Chief Research Officer at Buckingham Strategic Wealth and the author of numerous books on investing.
ALSO BY LARRY SWEDROE
Are stocks bought by noise traders at greater risk of crashing?
As goes January, so goes the year?
Is there a case for investing in private real estate?
How has ESG affected corporate bond markets?
Why investors in thematic ETFs are likely to be disappointed
© The Evidence-Based Investor MMXXII