Economic commentators are increasingly worried about inflation. In the UK, for example, inflation hit 10.1% in the 12 months to July, up from 9.4% in June, according to the Office for National Statistics. That means consumer prices are rising considerably faster than wages, leaving most people worse off in real terms. And there’s probably worse to come: the Bank of England has said inflation could peak at more than 13% before the end of this year.
It’s a similar story around the world. In the US last month, inflation was running at 8.5%, after hitting a more than 40-year high of 9.1% in June.
But what does all this mean for investors and those already in retirement? JONATHAN HOLLOW highlights two magic numbers to help you keep inflation in perspective.
The Bank of England expects inflation to peak at 13.3% in October 2022. There is debate about whether US inflation has peaked already, at 9.1%. Both may be optimistic under-estimates. Nobody has experienced such numbers for 50 years.
And they could be wealth-destroying numbers.
Inflation is best considered a wealth tax, but one imposed on everyone, even the poorest. Most people can bear it if it hovers around the central banks’ targets of around 2.5%. Very few ordinary people’s savings and wealth can withstand a prolonged period of high inflation.
So we should all be asking: what does inflation mean for me? For what it’s worth, in the current UK debate, I agree with Tory leadership candidate Rishi Sunak that inflation is the number one economic concern, and a pernicious enemy.
There is lots of debate about the sources of inflation, whether it is “imported” or “domestic” in the UK or US – and how it can be deflated. I’m not going to dip my toes in those turbulent waters. But I do want to introduce some long-term figures that can offer a perspective on how inflation affects savings.
The magic numbers
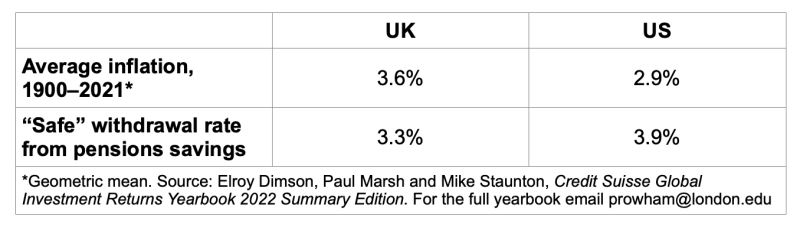
The two magic numbers are slightly different for UK and US readers, but they are pretty easy to absorb from the table below.
Why are these numbers so important? Let’s take them in turn.
The long-term record on inflation
In our forthcoming book How To Fund The Life You Want, Robin Powell and I quote Elroy Dimson, Paul Marsh and Mike Staunton, the experts in market history (starting with their 2002 work Triumph of the Optimists: 101 Years of Global Investment Returns). Their long-term data is updated in frequent reports published by Credit Suisse. Their 2022 summary report looks back on the inflationary record since 1900, so it gives us a view over 121 years, including two world wars and the disastrous stagflation of the 1970s that everyone is talking about now. It shows that over the long term, US inflation has been 2.9% on average (geometric mean). In the UK, it’s been 3.6%.
Nobody can promise that what has happened in the past will hold in the future. But these first “magic numbers” are the best guide we have to inflation. When planning your investments and retirement, they give you a reasonable assumption to use.
And what matters is how your investment portfolio performs over and above this figure, and over the long term.
Should we be worried about inflation? Certainly, if it endures at levels close to the current ones for five to ten years, it will upset all our calculations. But can a rationally invested (and used) portfolio withstand a sharp spike in inflation that lasts a couple of years? The historical record suggests that it can.
This brings us on to our second “magic number”, which helps you to understand the dance between growth in your portfolio, the income you take, and inflation.
The “safe” withdrawal rate
Something else that Robin and I explain in our book is how the growth in your retirement portfolio needs to have a healthy relationship with inflation, the fees you must pay to have it managed, and what you withdraw from your pot as retirement income. Some helpful academic researchers have come up with the concept of a “safe withdrawal rate” for your retirement income.
One of the single most important pieces of research in the history of retirement turned this into a quasi-rule. It was set out in a 2000 paper by William P. Bengen called Determining Withdrawal Rates Using Historical Data. Bengen modelled what could have happened to people who retired every year since 1926 if they had followed a simple rule. He assumed they would have a portfolio with near to 75% in equities. He asked how much they could have withdrawn from this initial portfolio, adjusting the same amount for inflation each year, without running out of money. Each time, he ran their retirement clock for 30 years.
After running his different scenarios, he concluded that the answer was “about 4%” and this has become very famous as a “4 per cent rule”.
However, the UK stock market tends to grow more slowly. Some later authors did similar work for UK stock market history. They also looked again at Bengen’s work for the US, in the light of later data. Wade Pfau asked: Does the 4 per cent rule work around the world? He came up with a figure of 3.36% based on UK market returns. He also said 4% was now a shade too optimistic for people in the US.
For reasons of conservatism and pessimism, I’ve rounded 3.36% down to 3.3% for UK readers, and shaving 4.0% down to 3.9% for US readers.
These are your second “magic numbers”.
Again, they offer no absolute guarantees (hence my scare quotes around the word “safe”). But they are the best evidence we have, based on very long-term data, about how much you could withdraw from an equity-led retirement pot and not be sunk by inflation.
In our book, we develop the metaphor of investing in a retirement pot as a “‘race’ between income, fees, inflation and growth”. Now I’ll turn to the final player in this race: fees.
Fees are like a double dose of inflation
A safe withdrawal rate will not work if you pay high fees to have your pension pot managed. Let us suppose you are dutifully withdrawing 3.3% as your own income. If you are paying 2.5% or even more in ongoing fees, it’s like punishing your retirement pot with a double dose of inflation.
This is why we devote so much of our book to demystifying the fees you are likely to have to pay, and showing how low they can go.
For my retirement savings, I am paying 0.28% in fees.
I recommend that you research (possibly with the help of our book) and find out: low can you go?
The importance of fees is why I’m such an admirer of the Transparency Task Force, for which Robin Powell is an Ambassador. It is trying to influence financial services firms to make all their fees simple and clear. Fees can be opaque, sometimes wilfully so. Yet all savers desperately need their fees to be crystal clear.
If you’re worried about inflation, there’s little you can do to control it. But you can put it in a rational long-term perspective against the evidence. And … you can take comfort in the fact that you can, at least, control your withdrawal rate — and your fees.
JONATHAN HOLLOW worked for the UK Government’s Money and Pensions Service and is a writer and commentator on consumer education and protection.
ALSO BY JONATHAN HOLLOW
Get Britain budgeting! A modest proposal for the Chancellor
Should our banks help us to budget?
Bitcoin is not an investment — I’m glad I sold it
Money shouldn’t be “dark matter” for today’s children
THE PODCAST
Have you discovered The TEBI Podcast? You’ll find it on SoundCloud, Spotify, Apple Podcasts, Podbean or your preferred podcast provider.
© The Evidence-Based Investor MMXXII


