Both value stocks and smaller companies have outperformed so far this year. But since value-oriented companies are typically smaller than their growth counterparts, is the recent resurgence of the value premium simply a consequence of its smaller size exposure? HAMISH PRESTON from S&P Dow Jones Indices takes a closer look.
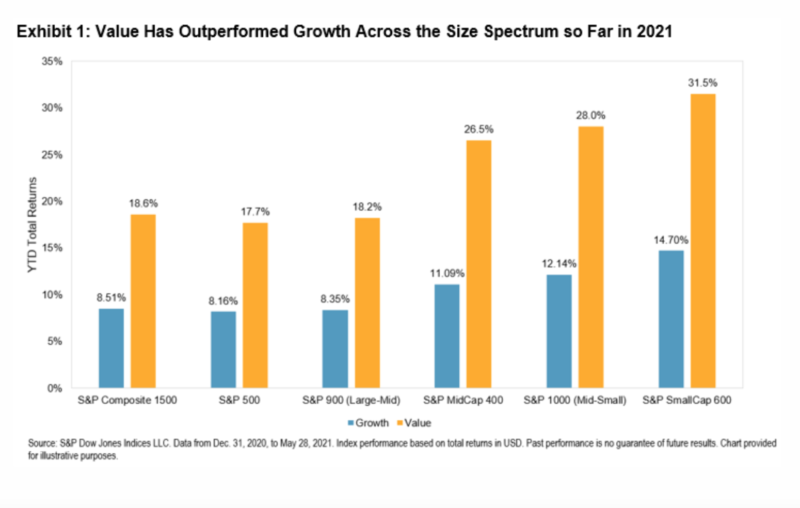
After more than a decade of underperformance, and in stark contrast to Growth’s dominance for much of 2020, Value has made an impressive comeback so far in 2021, outperforming Growth around the world, including across the size spectrum in the U.S. In fact, Value’s YTD outperformance against Growth in mid and small caps is the largest it’s ever been as of the end of May, while the S&P 500® Value’s 9.5% YTD outperformance is the second highest in its history through the first five months of a year.
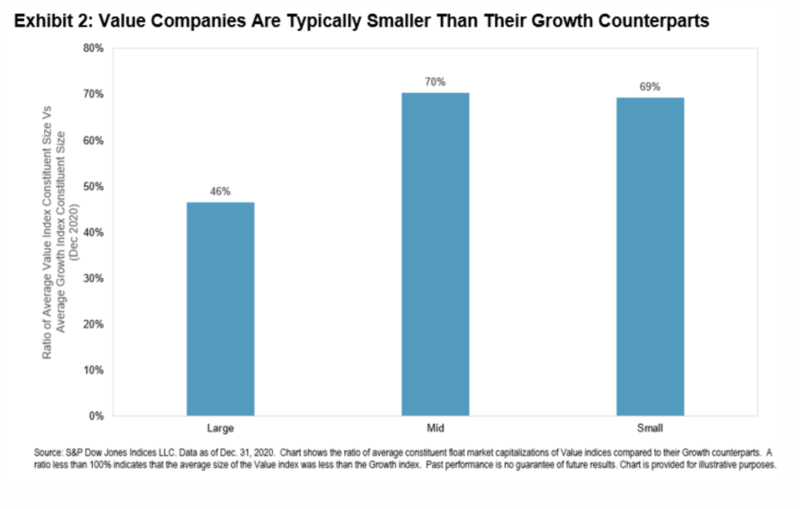
Smaller companies have also outperformed so far this year, which helps to explain why Equal Weight indices, with their smaller size tilt, have outperformed their cap-weighted parents. But the outperformance of smaller size raises an obvious question: since value-oriented companies are typically smaller than their growth counterparts (see Exhibit 2), is Value’s recent resurgence simply a consequence of its smaller size exposure?
In order to analyse the role of size in explaining Value’s recent returns, S&P 500, S&P MidCap 400®, and S&P SmallCap 600® constituents are divided into quintiles based on their market capitalisations at the end of 2020. Quintile 1 contains the largest 20% of stocks (by stock count) in each size segment, while Quintile 5 contains the smallest stocks.
Exhibit 3 shows the proportion of Value’s YTD excess returns that are attributed to selection and allocation effects across the different quintiles in large, mid, and small caps. If size was the only determinant of Value’s relative returns, the allocation effect would equal the total effect: there would be no impact from selecting value-oriented stocks. However, the choice of value-oriented constituents (selection effect) was typically more important than allocations to different size quintiles (allocation effect) and the selection effect accounted for the majority of Value’s YTD outperformance.
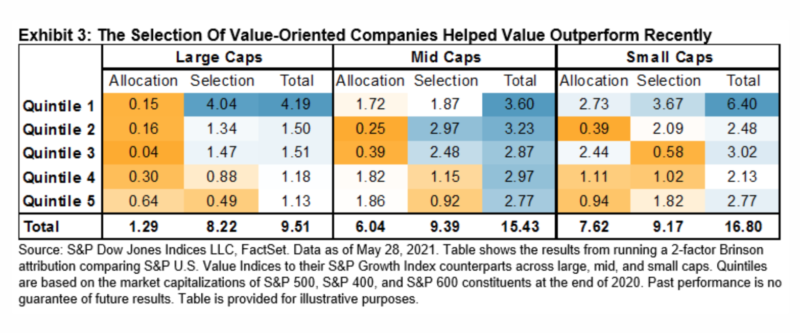
As a result, Value’s recent resurgence has been driven by the outperformance of more value-oriented companies rather than by their smaller size. And while we will have to wait and see what happens across the style box in the coming months, many investors may be enjoying riding the value wave for the first time in a few years.
HAMISH PRESTON is Associate Director, US Equity Indices, at S&P Dow Jones Indices.
This article was first published on the Indexology blog.
MORE FROM S&PDJI
For more valuable insights from our friends at S&P Dow Jones Indices, you might like to read these other recent articles:
What does history tell us about the value rally?
The case for tracking the venerable Dow Jones
A diverse portfolio is a strong portfolio
Why even Buffett has been buffeted by the index
The case for looking beyond the S&P 500
The impact of style bias on the latest SPIVA data
PREVIOUSLY ON TEBI
Louise Cooper: five things investors need to know
Ken French on the danger of false positives
New start? It pays to speak to a financial planner
The 60/40 portfolio ain’t broke
Passive growth makes it harder to generate alpha
A mindful way to pay your bills
VIDEO MARKETING FOR ADVISERS
Through our partners at Regis Media, TEBI provides a wide range of high-quality video content for financial advice and planning firms.
For firms in the UK, we can either come to you, or you can come to Regis Media’s studios in Birmingham, where we have a full white-screen set-up with lights and autocue. For firms outside the UK, we’re happy to talk through the options with you.
If it’s educational content you’re looking for, we have more than 200 pre-produced videos which can be tailored to include your branding, contact details and call-to-action.
Interested? Email Sam Willet, who will be happy to help you.
Picture: Markus Spiske via Unsplash
© The Evidence-Based Investor MMXXI
Robin is a journalist and campaigner for positive change in global investing. He runs Regis Media, a niche provider of content marketing for financial advice firms with an evidence-based investment philosophy. He also works as a consultant to other disruptive firms in the investing sector.