
By LARRY SWEDROE
In his December 23, 2011, article, Taking a Chance on the Larry Portfolio, New York Times columnist Ron Lieber described an investment approach designed to minimise the dreaded left tail (or black swan) risk of equities without sacrificing expected returns. The idea behind the “Larry Portfolio” is based on the academic research and historical evidence that small and value stocks have provided returns above the market — premiums (the size and value premium) that are unique (independent) of the overall risk of the market (referred to as market beta). Thus, they provide a diversification benefit. Those premiums (higher expected returns) allow you to have a lower allocation to risky stocks (because the stocks you own have higher expected returns) and thus a higher allocation to safe bonds. Historically, portfolios that have been “tilted” to these factors while reducing equity exposure have cut the left tail (and thus the dreaded sequence risk retirees face).
Table A below provides an example of how the Larry Portfolio might be implemented and compares the strategy with that of the typical 60/40 portfolio using a market portfolio. We will examine the 30-year period from June 1991-May 2021. For the typical 60/40 portfolio’s exposure to the U.S. total market, we use the CRSP 1-10 Index. And for our allocation to safe bonds, we use the Barclays Capital U.S. Intermediate Government Index. For the equity portion of the Larry Portfolio, we use the Dimensional U.S. Small Cap Value Index, and for the bond allocation we use the same Barclays Capital U.S. Intermediate Government Index. The portfolios are rebalanced annually.
The table also shows the two portfolios’ exposure to not only the market beta, size and value premiums but also their exposures to two other independent factors that have been found to provide premiums: momentum and quality. (For those interested in the literature behind these factors as well as the history of asset pricing models, I recommend my 2016 book, co-authored with Andrew Berkin, Your Complete Guide to Factor-Based Investing.)
- Portfolio A: 60% CRSP 1-10 Index/40% Barclays Capital U.S. Intermediate Government Index
- Portfolio B: 40% Dimensional U.S. Small Cap Value Index/60% Barclays Capital U.S. Intermediate Government Index
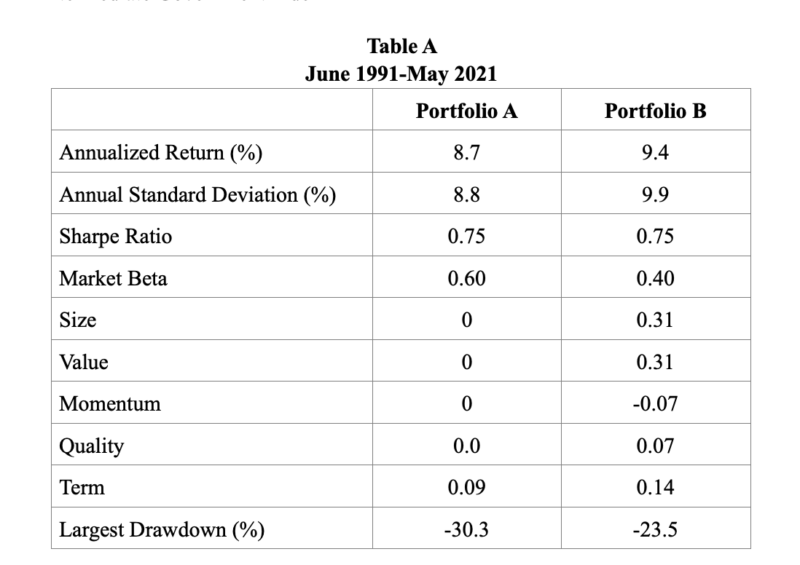
Source: Refinitiv Lipper, Ken French Data Library, Dimensional, AQR
Portfolio B produced a slightly higher return than Portfolio A but with slightly higher volatility. The risk-adjusted returns, as measured by the Sharpe ratio, were the same for the two portfolios, as Portfolio B’s higher return was offset by its higher volatility. However, Portfolio B experienced a much lower worst-case drawdown (-23.5 percent versus -30.3 percent). In other words, investors significantly cut the left tail risk, the main goal of the strategy, without negatively impacting the return or the risk-adjusted return. It’s worth noting that these results were achieved despite the fact that the value premium experienced its worst drawdown by far near the end of the period, and its second worst drawdown occurred around the turn of the century. In both cases the drawdowns occurred almost exclusively due to a widening of the valuations between growth and value stocks to the widest levels experienced—and since valuation spreads provide information on future returns, those historically wide spreads predict an above-average value premium going forward.
Note that the above example is an “extreme” version of a tilted portfolio, using only small value stocks. Of course, portfolios can be designed with any degree of “tilt,” depending on each individual investor’s preferences and objectives.
The bottom line is that even despite the worst drawdown ever for small value stocks near the end of the period, Portfolio B achieved its stated objective of reducing tail risk without sacrificing returns. Of course, this outcome was not guaranteed. However, investing isn’t about guarantees. Instead, it’s about putting the odds in your favor, which is the best we can do. With that in mind, we can review the historical evidence on the performance of small value stocks versus the total market. Over the 93-year period 1928-2020, the Dimensional U.S. Small Cap Value Index outperformed the U.S. total market in 67 percent of the 89 five-year rolling periods, 82 percent of the 84 rolling 10-year periods, 89 percent of the 79 rolling 15-year periods, and 100 percent of the 74 rolling 20-year periods.
Global portfolios
Because of the benefits of diversification, investors should include international equities in their portfolio. We will also examine how the Larry Portfolio performed when they’re added. For Portfolio A’s allocation to the market portfolio for developed markets, we will use the MSCI World Ex US IMI (net div.) with an inception date of June 1994, and for the emerging markets allocation, we will use the MSCI Emerging Markets IMI (net div.) with an inception date of June 1994. Because the U.S. makes up about half the global market, developed non-U.S. makes up about three-eighths and emerging markets about one-eighth, Portfolio A’s 60 percent equity allocation will be made up of 30 percent CRSP 1-10 Index, 22.5 percent MSCI World Ex US IMI (net div.) and 7.5 percent MSCI Emerging Markets IMI (net div.). As before, the bond allocation will be to the Barclays Capital U.S. Intermediate Government Index. For Portfolio B for the developed markets allocation, we will use Dimensional’s International Small Cap Value Index, and for the emerging markets allocation, we will use Dimensional’s Emerging Markets Value Index. Because the inception date for the MSCI World Ex US IMI (net div.) and MSCI Emerging Markets IMI (net div.) is June 1994, that will be our start date. The end date is May 2021, giving us a 28-year period. Again, portfolios are rebalanced annually.
- Portfolio A: 30% CRSP 1-10 Index, 22.5% MSCI World Ex US IMI (net div.), 7.5% MSCI Emerging Markets IMI (net div.)/40% Barclays Capital U.S. Intermediate Government Index.
- Portfolio B: 20% Dimensional U.S. Small Cap Value Index, 15% Dimensional International Small Cap Value Index, 5% Dimensional Emerging Markets Value Index/60% Barclays Capital U.S. Intermediate Government Index.
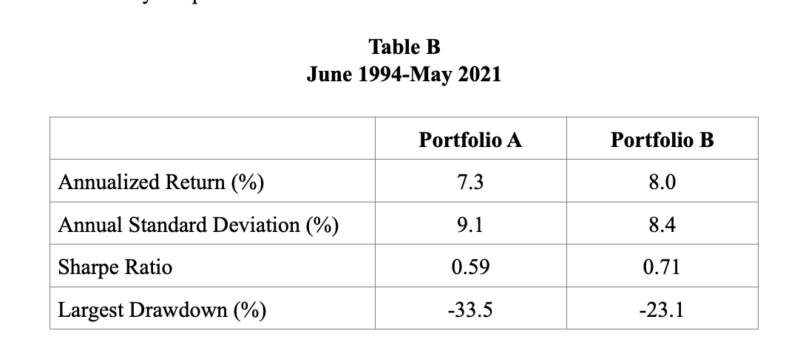
As you can see, Portfolio B produced superior results no matter the metric. It produced a higher return, a lower level of volatility, a superior Sharpe ratio, and a much smaller largest drawdown. My book, Reducing the Risk of Black Swans, co-authored with Kevin Grogan, provides the academic evidence and the economic logic behind this strategy.
Now let’s turn to some of the common objections to the Larry Portfolio, one with a highly tilted equity allocation. They tend to relate to the all-important issue of diversification.
Diversification and the Larry Portfolio
Diversification has been called the only free lunch in investing. Despite its obvious benefits, many investors fail to diversify their portfolios. One good example of that failure is the well-known “home-country” bias. This bias leads investors to make much higher allocations to domestic stocks than a global market weighting would call for. Despite the U.S. share of global equity capitalisation of about 50 percent, most portfolios I see have 10 percent or less of their assets invested in international stocks.
The main objection I hear is that the Larry Portfolio concentrates all of its risk in small value stocks — a relatively small corner (just a few percent) of the market — while a total market fund owns stocks across all asset classes.
What we call “modern financial theory” has provided investors with a nonconventional way to think about diversification, leading to an approach that can improve risk-adjusted returns. Consider the following: An investor, desiring to diversify his portfolio globally and across asset classes, buys a total U.S. stock market index fund and a total international stock index fund. Because the funds are total market funds, the investor owns both small and large stocks as well as value and growth stocks. That’s the conventional way of thinking about diversification.
Modern financial theory suggests a different way. To explain how markets work, financial economists have developed asset pricing models. The successor to the first asset pricing model, the CAPM, which used beta as its sole factor, was the Fama-French three-factor model. The three factors in the model are beta (exposure to the risk of the stock market), size (exposure to the risk of small stocks) and value (exposure to the risk of value stocks). These three factors were able to explain about 90 percent of differences in returns between diversified portfolios. In other words, it’s exposure to these factors that determines the majority of the risk and return of the portfolio. It’s important to understand that each of the factors represents a long/short portfolio:
- The beta factor is the return of stocks minus the return on one-month Treasury bills.
- The size factor is the return of small stocks minus the return of large stocks.
- The value factor is the return of value stocks minus the return of growth stocks.
Because beta is the measure of the risk of a portfolio relative to the risk of the stock market, a total stock market (TSM) fund has, by definition, an exposure to beta of 1. But, while a TSM fund does hold small stocks, it has no exposure at all to the size factor. This seeming contradiction confuses many investors. Recall that factors are long/short portfolios. Thus, again by definition, while the small stocks in a TSM fund provide positive exposure to the size factor, the large stocks in the fund provide an exactly offsetting amount of negative exposure. That puts the fund’s net exposure to the size factor at 0. The same is true for value stocks. While the value stocks in a TSM fund provide positive exposure to the value factor, the growth stocks in the fund provide an exactly offsetting amount of negative exposure. As a result, net exposure to the value factor is 0. Thus, as can be seen in Portfolio A of Table A above, the TSM portfolio has the following factor exposures: beta 1, size 0, value 0. It’s not diversified across the factors that determine returns.
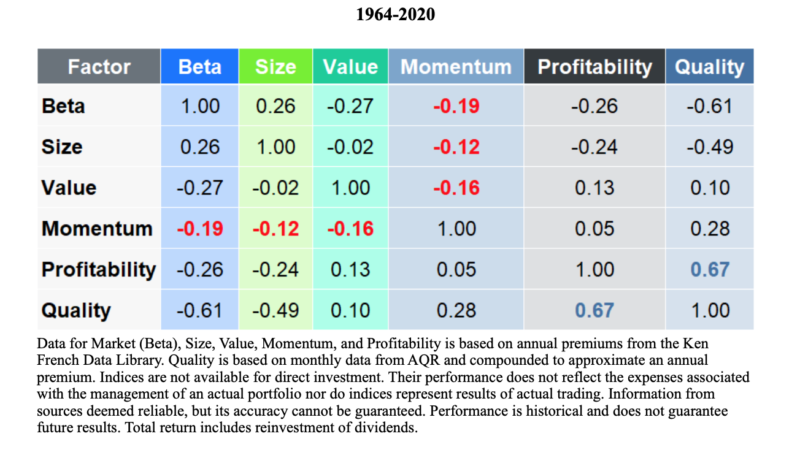
To diversify a portfolio across factors, you must “tilt” it so that it owns more than the market’s share of small and value stocks. Like beta (which has provided an annual average premium of 8.7 percent over the period 1927-2020), the size, value, momentum and quality (quality factor data is 1963-2020) factors also have provided annual average premiums (3.1 percent, 4.0 percent, 9.1 percent and 4.3 percent, respectively). Thus, pursuing exposure to these factors presents investors with two asset allocation options. The first option, and the “conventional” way to use factor exposure, is to increase the portfolio’s expected return. Because these factors have shown very low correlations to each other, historically, tilted portfolios have earned higher Sharpe ratios (meaning they have delivered higher returns while experiencing very similar volatility). The following table, providing the historical correlations of these factors, demonstrates that these are unique factors, providing diversification benefits. The negative correlations of the beta, size and value factors with momentum factors are in red to highlight their importance.
The second option, as we have discussed, is to reduce risk while attempting to maintain the portfolio’s expected return. That’s accomplished by lowering exposure to beta at the same time exposure to other premiums is increased. In this way, you need less exposure to beta to achieve the same expected return because the equities you do hold have a higher expected return than the stock market in its entirety. The outcome is a portfolio that’s more diversified in terms of its factor exposure (exposure to beta went down while exposure to both size and value, and perhaps other factors, went up). In addition, as exposure to beta falls with the portfolio’s lower equity allocation, exposure to term risk rises due to the now-greater bond allocation, further diversifying portfolio risk.
As you will see, when you think about risk in terms of “risk points” instead of the percent allocation, because stocks are so much more volatile than safe bonds, a typical 60 percent stock/40 percent bond portfolio has about 85 percent of its risk concentrated in the stock allocation. Here’s the math:
- Typical portfolio: 60% stocks/40% bonds
- Equity volatility: 20%
- Typical Buckingham bond portfolio (4-5 year average maturity) volatility: 5%
- Total risk: Equity risk (60 x 20 = 1200) + bond risk (40 x 5 = 200) = 1400
1200/1400 = 86%
Looking back at Table A, you see that Portfolio B is much more diversified across the factors that determine the risk and expected return of the portfolio. The bottom line is that a total stock market approach has all its eggs in one factor (or risk) basket—beta—while a tilted portfolio can diversify its risks across more risk baskets. Additionally, a tilted portfolio can gain greater exposure to the term factor found in its bond holdings. Harvesting different risk baskets, each with premiums and low return correlations with the others, is a prudent way for investors to diversify their portfolios while improving risk-adjusted returns.
Among the benefits of diversifying across factors with low to negative correlations is that the much-dreaded tail risk (or the impact from a black swan event) can be reduced. And that increases the odds that investors will achieve their goal of not outliving their financial assets. Of course, they’ll also reduce the potential for outsized gains, but for risk-averse investors that’s probably a welcome trade-off.
Diversification by the numbers
A related diversification question is about the number of stocks owned. Let us compare the Vanguard Total Stock Market Index Fund (VTSMX) with the Dimensional U.S. Small Cap Value (DFSVX), a fund which could be used to implement the Larry Portfolio. While VTSMX holds almost 3,800 stocks, DFSVX holds almost 1,000, more than sufficient to effectively diversify away the idiosyncratic risks of individual companies. More importantly, DFSVX’s portfolio holdings are much less concentrated (more diversified). Its largest holding makes up less than 1 percent of the fund, and its top 10 holdings make up less than 8 percent. That’s in contrast to a total market fund in which the top two holdings (as of May 31, 2021), Apple (5.5 percent) and Microsoft (5.3 percent), account for almost 11 percent of the fund, and the top 10 holdings account for almost 27 percent of the fund.
We can also examine the question of diversification across industries. While the specific industry allocations are different, we can examine the concentration in industries. Figures are as of June 2021. For VTSMX, the highest concentration in a single industry/sector was 26 percent, the three largest allocations made up 56 percent, and the five largest made up 81 percent of the portfolio. For DFSVX, the figures were a similar 29 percent, 64 percent and 81 percent, respectively.
Small Value can experience long periods of underperformance
The final objection to the Larry Portfolio is that small value can experience long periods of underperformance. Of course, this is true. But more importantly, it is true of all risk assets. That is why we diversify risks, not concentrate them. In fact, the S&P 500 Index has experienced longer and more extended periods of negative premiums than has small value. Consider that the S&P 500 Index has experienced three periods of at least 13 years when it underperformed riskless one-month Treasury bills:
- 1929-1943: The S&P 500 Index returned just 0.3 percent per annum versus the 0.7 percent return to one-month Treasury bills. During this period small value stocks, as measured by the Dimensional U.S. Small Cap Value Index, provided basically the same return, 0.1 percent.
- 1966-1982: The S&P 500 Index returned 6.8 percent per annum versus the 7.0 percent return of one-month Treasury bills. During this period the Dimensional U.S. Small Cap Value Index returned 16.0 percent a year, an outperformance of 9.2 percentage points a year for 17 years.
- 2000-12: The S&P 500 Index returned 1.7 percent per annum versus the 2.1 percent return of one-month Treasury bills and the 12.5 percent return of the Dimensional U.S. Small Cap Value Index, an outperformance of 10.8 percentage points per year for 13 years.
As you can see, small value stocks are not the only asset class that can experience long periods of underperformance. In addition, during two of the three long periods when the S&P 500 underperformed one-month Treasury bills, small value stocks provided strong diversification benefits. And while the S&P 500 Index experienced periods of 13, 15 and 17 years that it underperformed one-month Treasury bills, small value stocks also underperformed one-month bills for the 15-year period ending 1943, but there was no other 10-year period when this occurred. The next longest period of small value stocks underperforming one-month Treasury bills was the ten-year period ending 1974. During this period, the Dimensional U.S. Small Cap Value Index earned 1.5 percent a year versus the 5.4 percent a year return of one-month Treasury bills. However, the S&P 500 Index performed even worse, returning just 0.1 percent a year. And the third longest was the overlapping eight-year period ending 1976. During this period the Dimensional U.S. Small Cap Value Index returned 5.4 percent a year versus 5.9 percent for one-month Treasuries. But it outperformed the S&P 500 Index return of 4.1 percent a year. Since 1976 there has been no period longer than the five years 2007-2011 when small value stocks underperformed one-month Treasuries. The bottom line is that the S&P 500 Index has experienced more extended periods of negative returns relative to one-month Treasuries, and they have been longer.
There is one other important point we need to cover.
Valuations matter
The best predictor we have of future long-term returns is current valuations, with the Shiller CAPE 10 providing as much information as any valuation metric. With this in mind, we can observe that the three periods of extended underperformance by the S&P 500 Index were all preceded by the CAPE 10 at historically high levels relative to the long-term mean of about 17:
- In September 1929, the CAPE 10 exceeded 32.
- At the end of 1965, the CAPE 10 exceeded 24.
- At the end of 1999, the CAPE 10 exceeded 44.
As of June 29, 2021, the CAPE 10 exceeded 38. That should serve as a warning to total market investors, considering that they have all their eggs in that one market beta basket. At the same time, because of their recent historic drawdown relative to the valuations of growth stocks, small value stocks are trading at close to their most historically cheap levels. Their relative valuations led the research team at Vanguard to conclude: “Based on our fair-value model, we expect value to outperform growth over the next 10-year period by as much as 5% to 7% per year and perhaps by even more over the next five years.”
Summary
As much as we would like to believe otherwise, there are no clear crystal balls when it comes to risky assets — that is why they are risky. Thus, the best we can to is to put the odds in our favor. And the historical evidence, along with current valuations, suggests that as you tilt to small value, you increasingly put the odds in your favor. With that said, despite the fact that the evidence clearly shows that all risk assets go through long periods of underperformance, my long experience as an advisor has taught me that the hardest role for many investors is experiencing periods of underperformance relative to some benchmark that the financial media reports on daily (such as the S&P 500 Index), a benchmark that should be totally irrelevant to investors who know their financial history and understand the logic and benefits of diversification. The reason they find it hard is because they tend to believe that when it comes to risk assets, three years is a long time, five years a very long time and 10 years an eternity. On the other hand, as you have seen, when it comes to the S&P 500 Index — or any risk asset for that matter — even ten years should be treated as noise.
The problem of “shortsightedness” can be compounded when you diversify away from the market portfolio, adding other unique risk assets with long histories of premiums (as with the Larry Portfolio), and your portfolio underperforms the market. The reason is that if you have a market portfolio and it performs poorly, at least you are not alone in your misery, and misery loves company. Underperforming unconventionally, therefore, is much harder than failing conventionally when others are also performing poorly. Thus, if you want to put the odds in your favour, by investing “unconventionally” you must accept that psychological risk as the price you pay for putting the odds in your favour. In other words, even diversification isn’t a free lunch because it comes with psychological risks.
Important Disclosure: This article is for general information only and is not intended to serve as specific financial, accounting or tax advice. Certain information is based upon third party data which may become outdated or otherwise superseded without notice. Third party information is deemed to be reliable but its accuracy and completeness cannot be guaranteed. Indices are not available for direct investment. Their performance does not reflect the expenses associated with the management of an actual portfolio nor do indices represent results of actual trading. Total return includes reinvestment of dividends and capital gains. Performance is historical and does not guarantee future results. By clicking on any of the links above, you acknowledge that they are solely for your convenience, and do not necessarily imply any affiliations, sponsorships, endorsements or representations whatsoever by us regarding third-party websites. We are not responsible for the content, availability or privacy policies of these sites, and shall not be responsible or liable for any information, opinions, advice, products or services available on or through them. The opinions expressed by featured authors are their own and may not accurately reflect those of the Buckingham Strategic Wealth® or Buckingham Strategic Partners®, collectively Buckingham Wealth Partners. LSR-21-115
LARRY SWEDROE is Chief Research Officer at Buckingham Strategic Wealth and the author of numerous books on investing.
ALSO BY LARRY SWEDROE
The impact of recency bias on equity markets
Passive growth makes it harder to generate alpha
Should you buy stocks with very negative recent returns?
Should investors we worried about US government debt?
Return signal momentum: a new strategy worth following?
Is there a replication crisis?
PREVIOUSLY ON TEBI
Finding the total cost of investing is almost impossible
The pension time bomb: how worried should we be?
Has size contributed to value’s recent revival?
Louise Cooper: five things investors need to know
Ken French on the danger of false positives
New start? It pays to speak to a financial planner
CONTENT FOR ADVICE FIRMS
Through our partners at Regis Media, TEBI provides a wide range of high-quality content for financial advice and planning firms. The material is designed to help educate clients and to engage with prospects.
As well as exclusive content, we also offer pre-produced videos, eGuides and articles which explain how investing works and the valuable role that a good financial adviser can play.
If you would like to find out more, why not visit the Regis Media website and YouTube channel? If you have any specific enquiries, email Sam Willet, who will be happy to help you.
© The Evidence-Based Investor MMXXI
Robin is a journalist and campaigner for positive change in global investing. He runs Regis Media, a niche provider of content marketing for financial advice firms with an evidence-based investment philosophy. He also works as a consultant to other disruptive firms in the investing sector.


