The tendency for strong market performance to be concentrated in a subset of stocks is therefore also a cautionary tale about the importance of diversification — investors with concentrated portfolios may actually miss out on the very stocks that deliver the best of what the market has to offer. An investment approach built around broad diversification can help achieve a more reliable outcome for investors over the long term — sharp acronym or not.

This is a guest post from DIMENSIONAL FUND ADVISORS
The stocks commonly referred to by the FAANG moniker — Facebook, Amazon, Apple, Netflix, and Google (now trading as Alphabet) — have posted impressive gains through the years, with all now worth many times their initial-public-offering prices. The notion of FAANG stocks as a powerful group of top-performing stocks, holding sway over the markets has sunk its teeth into some investors. But how much of the market’s recent returns are attributable to FAANG stocks? And does their performance point to a change in the markets?
Over the 10 years through December 31, 2018, the US broad market [1] returned an annualised 13.4%, as shown in Exhibit 1. Excluding FAANG stocks, the market returned 12.6%. The 0.8-percentage-point bump resulted from the FAANGs collectively averaging a 30.4% yearly return over the decade.
Exhibit 1: A little help from the FAANGs
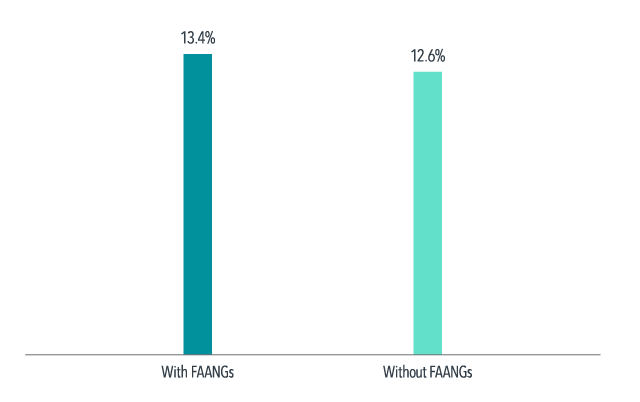
Annualised US market compound returns with and without Facebook, Amazon, Apple, Netflix, and Alphabet (Google), 2009-2018
Investors may be surprised to learn that it is actually common for a subset of stocks to drive a sizeable portion of the overall market return. Exhibit 2 shows that excluding the top 10% of performers each year from 1994 [2] to 2018 [3] would have reduced global market performance from 7.2% to 2.9%. Further excluding the best 25% of performers would have turned a positive return into a relatively large negative return.
Exhibit 2: Weighing the impact

Global stock market performance excluding top performers, 1994-2018
This lesson also applies to capturing the premiums associated with a company’s size and its price-to-book ratio. Research by Eugene Fama and Kenneth French (Migration, 2006) provides evidence that these premiums are driven in large part by a subset of stocks migrating across the market.
Research has shown no reliable way to predict the top-performing stocks. Looking at the top 10% of stocks by performance each year since 1994, on average less than a fifth of that group has ranked in the top 10% the following year.
Footnotes
[1] With-FAANGs portfolio formed each month including common stocks listed on NYSE, NYSE MKT and NASDAQ. Stocks are weighted by market capitalisation. Without-FAANGs formed similarly but excluding Facebook, Apple, Amazon, Netflix, Alphabet (Google). Source: Dimensional, using data from CRSP.
[2] The onset of broad coverage of all-cap stock data across developed and emerging markets.
[3] All eligible common stocks in all eligible developed and emerging markets, ranked by total return. Source: Dimensional, using data from Bloomberg LP.
This article first appeared on the Dimensional Fund Advisors blog, Dimensional Perspectives.
Interested in more insights from Dimensional? Here are some more articles from this series:
You can’t predict market movements: 2019 is a case in point
DFA’s new investment factor explained
Has value really lost its vigour?
Booth & Fama: a friendship that changed investing
Do IPO returns match the hype?