By LARRY SWEDROE
The two holy grails for believers in active portfolio management are the ability to identify in advance the few active managers that will outperform in the future, and the ability to predict the equity risk premium (ERP), allowing investors to successfully time the market. Unfortunately, while many have tried to identify metrics such as past performance, concentration and active share as predictive metrics of future mutual fund performance, none of the efforts have succeeded. For example, in their November 2021 study, Is Active Share Unattractive?, Morningstar found that despite exhibiting greater risk, high active share funds failed to deliver superior net-of-fee results in any category. Even when double sorting mutual funds based on active share and past performance, Martijn Cremers, Jon Fulkerson and Timothy Riley, authors of the 2022 study Active Share and the Predictability of the Performance of Separate Accounts found no statistically significant evidence of the ability to identify in advance the few future alpha generators. There are similar findings on the ability to time the market using predictions of the equity risk premium.
Amit Goyal, Ivo Welch and Athanasse Zafirov, authors of the December 2021 paper A Comprehensive Look at the Empirical Performance of Equity Premium Prediction II, reexamined whether 29 variables from 26 papers recently published in prominent journals were useful in predicting the equity premium in-sample and out-of-sample. Their samples included the original periods in which these variables were identified but ended as much as a decade later. They found that most variables had already lost their empirical support, though a handful still performed reasonably well—25 variables showed lower in-sample significance in the extended sample period, and only four variables predicted about equally well or better. In fact, half of the predictors performed so poorly that they not only failed to beat all equity all the time (buy and hold), but they even lost money in absolute terms. Their second strategy was long the equity premium unless the predictor signal was extremely bearish (worse than the prevailing 25th percentile). Their third and fourth strategies also scaled the investment based on the magnitude of the signal relative to preceding signals. Not a single variable outperformed all equity all the time in a statistically significant manner — in fact, none could muster an absolute T-statistic above 1.3. Note that while the Shiller CAPE 10 earnings yield (E/P) does provide information on future returns, with higher earnings yields forecasting higher real returns, the potential dispersion of returns is still too wide for the metric to be useful as a timing tool.
David Blitz contributes to the literature on predicting the equity risk premium with his study, Expected Stock Returns When Interest Rates Are Low, published in the July 2022 issue of The Journal of Portfolio Management, in which he examined whether the theory that the equity risk premium is a reward that investors earn on top of the prevailing risk-free return was supported by the long-term historical data—all else equal, total expected stock returns should increase with the level of the risk-free return.
Blitz’s data was monthly U.S. equity market returns and risk-free Treasury bill returns over the period January 1866-June 2021. He defined the equity excess return as the total equity return minus the return on risk-free Treasury bills, and the equity risk premium as the long-term average equity excess return. Throughout the analyses, he log-transformed all equity (excess) returns to make them additive over time, accounting for the fact that recovering a loss of 20 percent requires a gain of 25 percent to break even again.
His main control factor was the CAPE ratio of Robert Shiller, a valuation factor that is available from January 1881 onward. He also considered several additional control factors, including fast and slow ones. The fast control factors were equity momentum and bond momentum. For equity momentum, he used the log of the total equity return over the past 12 months. His proxy for bond momentum was the change in the 10-year Treasury bond yield over the past 12 months. The slow control factors were the term spread (TERM) and default spread (DEF). The term spread was the yield difference between 10-year Treasury bonds and Treasury bills, and the default spread was the yield difference between BAA- and AAA-rated corporate bonds. The latter series is available from 1919 onward.
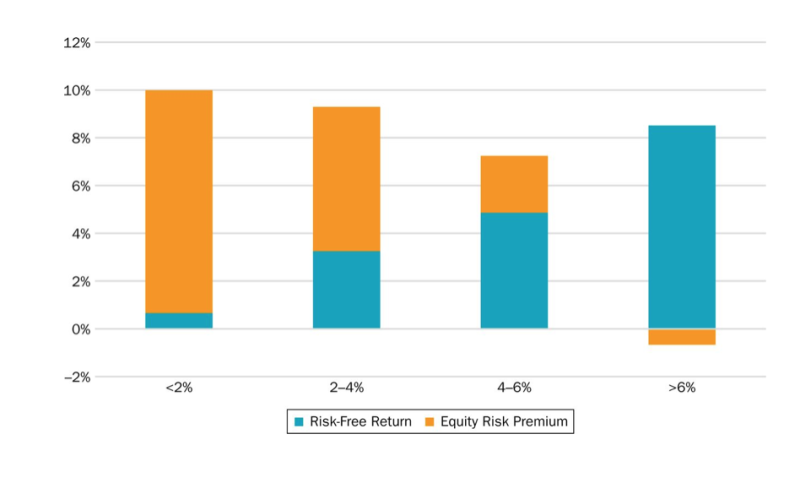
Blitz also examined international data from 16 developed countries with the start date of the series varying between 1870 and 1900 for the various countries and ending in 2021. He stated: “If equities offer a fairly stable risk premium, then we would expect to observe a similar-sized risk premium for all levels of the risk-free return and total returns that are clearly increasing with the level of the risk-free return.” However, as shown in the chart below, the actual picture looks very different, with similar-sized total returns for all levels of the risk-free return and an inverse relation between the equity risk premium and the risk-free return. In addition, when the risk-free return was more than 6 percent, the average total return on equities was not sufficient to obtain a positive average risk premium.

Using the longest sample period for which all variables were available, February 1881 to June 2021, Blitz regressed monthly equity returns minus the risk-free return (Rm − Rbills) on the prevailing risk-free return (Rbills) and earnings yield (inverted CAPE). If the equity risk premium was independent of the level of the risk-free return, we would expect the estimated coefficient for the risk-free regressor to be indistinguishable from zero. However, if total equity returns were similar regardless of the level of the risk-free return, we would expect the estimated coefficient to be about −1, to offset the subtraction of the risk-free return from the equity returns on the left-hand side of the regression.
Blitz found that the estimated coefficient for the risk-free return was strongly negative, −2.07 (t = −3.59)—rejecting the hypothesis that the equity risk premium is independent of the level of the risk-free return. In fact, he explained, “because the estimated coefficient for the risk-free return is well below −1, it seems that there is even an inverse relation between total expected equity returns and the level of the risk-free return,” as seen in the above chart. As a test of robustness, using international data he found similar results: “For most countries the total stock returns are flat or even inversely related to the level of the risk-free return, implying a very high equity risk premium when the risk-free return is low, and a very low equity risk premium when the risk-free return is high.”
Blitz also found that “the estimated coefficient for earnings yield had the expected positive sign and is also statistically significant (t = 3.09). Taken together, these regression results imply that the equity risk premium increases with the earnings yield but decreases with the risk-free return.” His results were robust to using the slow or fast signals as additional control variables, and to using the return on long-term Treasuries as the risk-free rate.
Blitz observed that the predicted returns exhibited stronger time variation when additionally controlling for earnings yield (inverted CAPE). However, predicted total returns remained more stable than the predicted risk premium. In addition, predicted total returns were not lower during the periods with a low risk-free return, such as the 1940s and 2010s, than during the periods with a high risk-free return, such as the 1970s and 1980s. His findings led him to conclude: “As a result, the predicted equity risk premium is generally higher in the periods with a low risk-free return.”
Blitz concluded: “It is important to realise that we do not propose a market timing strategy. We find that the equity risk premium tends to be larger when the risk-free return is low and that the equity risk premium tends to be smaller when the risk-free return is high. However, we do not identify scenarios in which the equity risk premium is strongly negative, which would be needed to justify short positions. Thus, when used as a tactical asset allocation strategy, our signal would be long 100% of the time. We see the application of our insights more at the strategic asset allocation level, such as asset liability management studies.”
Investor takeaways
Blitz’s findings are of significance, as he demonstrated that the empirical data rejects the hypothesis that a higher risk-free rate implies higher total expected stock returns. Instead, total expected stock returns appear to be unrelated (or perhaps even inversely related) to the level of the risk-free return, implying that the equity risk premium is higher when the risk-free return is low than when it is high. With that said, a takeaway should be that investors cannot use the historical data to implement a profitable tactical asset allocation rule. However, his results do present a challenge to the conventional wisdom about expected stock returns and thus should be considered in strategic asset allocation decisions, especially when the risk-free return is very high or very low compared to its historical average.
For informational and educational purposes only and should not be construed as specific investment, accounting, legal, or tax advice. Certain information is based upon third party data which may become outdated or otherwise superseded without notice. Third party information is deemed to be reliable, but its accuracy and completeness cannot be guaranteed. By clicking on any of the links above, you acknowledge that they are solely for your convenience, and do not necessarily imply any affiliations, sponsorships, endorsements or representations whatsoever by us regarding third-party websites. We are not responsible for the content, availability or privacy policies of these sites, and shall not be responsible or liable for any information, opinions, advice, products or services available on or through them. The opinions expressed by featured authors are their own and may not accurately reflect those of Buckingham Strategic Wealth® or Buckingham Strategic Partners®, collectively Buckingham Wealth Partners. Neither the Securities and Exchange Commission (SEC) nor any other federal or state agency have approved, determined the accuracy, or confirmed adequacy of this article. LSR-22-326
LARRY SWEDROE is Chief Research Officer at Buckingham Strategic Wealth and the author of numerous books on investing.
ALSO BY LARRY SWEDROE
Do funds with more than one manager perform better?
The role of concentration in fund performance
How does R&D spending affect future returns?
Factor momentum and stock momentum
OUR STRATEGIC PARTNERS
Content such as this would not be possible without the support of our strategic partners, to whom we are very grateful.
TEBI’s principal partners in the UK are S&P Dow Jones Indices and Sparrows Capital. We also have a strategic partner in Ireland — Biograph Wealth Advisors, a financial planning firm in Dublin.
We are currently seeking partnerships in North America and Australasia with firms that share our evidence-based and client-focused philosophy. If you’re interested in finding out more, do get in touch.
© The Evidence-Based Investor MMXXII


