
By LARRY SWEDROE
The relative performance of value stocks in the U.S. has been so poor in the past few years that many investors have jumped to the conclusion that the value premium is dead. One explanation offered for the death of value is that the publication of the research led to overcrowding. Before you jump to the conclusion that value investing is dead, it’s worth going to our trusty videotape to review the historical evidence and see if there are any lessons to be learned. As Spanish philosopher George Santayana advised: “Those who cannot remember the past are condemned to repeat it.”

The following table shows the returns of the Fama-French U.S. Value Research Index relative to those of the S&P 500 Index. (Data on Fama-French indexes in the paragraphs that follow are from the Fama/French Data Library.)
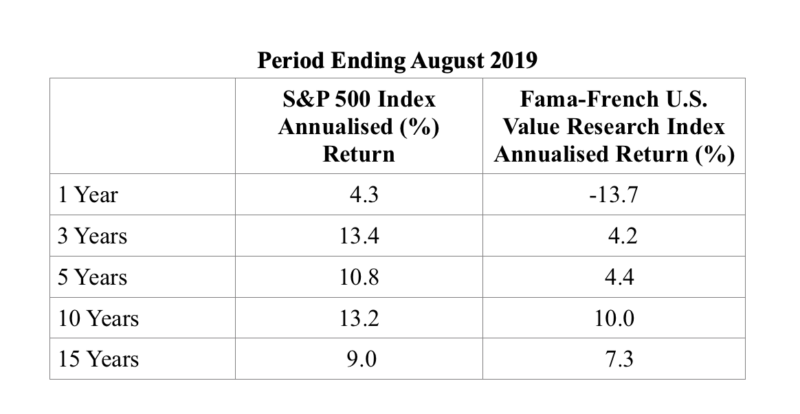
As you can see, regardless of the period we look at, US value stocks have underperformed. The question for investors is: Does this signal the death of the value premium? Or have we experienced such periods before, only to see the value premium restored by future outperformance of an even greater magnitude? The historical evidence allows us to answer the question. Before doing so, it’s important to note that while U.S. value stocks underperformed the S&P 500 over the 15 years ending August 2019, if we just go back to the end of 2016 (less than three years ago) and review the same data set, we get a different answer. Over the one-year period ending in 2016, value outperformed the S&P 500 by 15.7 percent (12.6 versus 28.3). Over the five-year period, it outperformed by 1.5 percent (14.7 versus 16.2). And over the 15-year period, it outperformed by 3.7 percent (7.0 versus 10.7). Over the three- and 10-year periods ending in 2016, value underperformed by 1.9 percent (8.9 versus 7.0) and 0.2 percent (7.0 versus 6.8), respectively.
In other words, basically all of value’s underperformance has occurred over the past three years, not ten or 15. It’s also important to note that investors looking at the 90-year period ending in 2016 would have noted that value’s outperformance was 2.9 percent (10.0 versus 12.9). That’s evidence of a persistent premium across economic cycles. In addition, the value premium has been present, and of similar size, in both international developed and emerging markets.
Let’s turn now to the question of whether we experienced such long periods of value underperformance in the past, and if we have, what we might learn from such periods. The following table shows the performance of value stocks for the period ending in 1999.
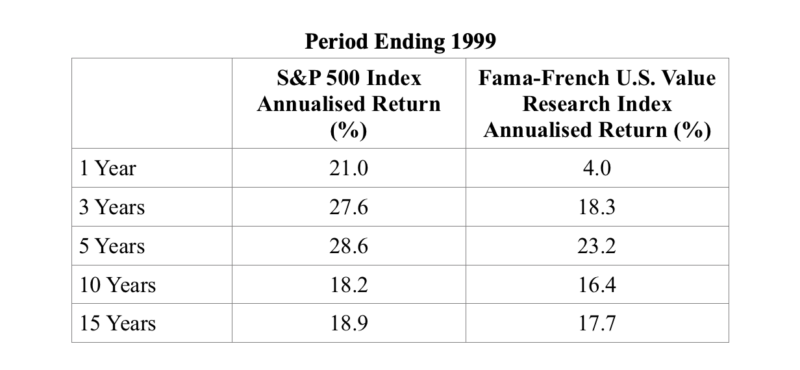
As you can see, just as in the most recent period, U.S. value stocks underperformed over each of the periods we examined. In fact, the data looks eerily similar in terms of the performance gap. Now let’s jump forward just one year, to the end of 2000, and see how the world looked.
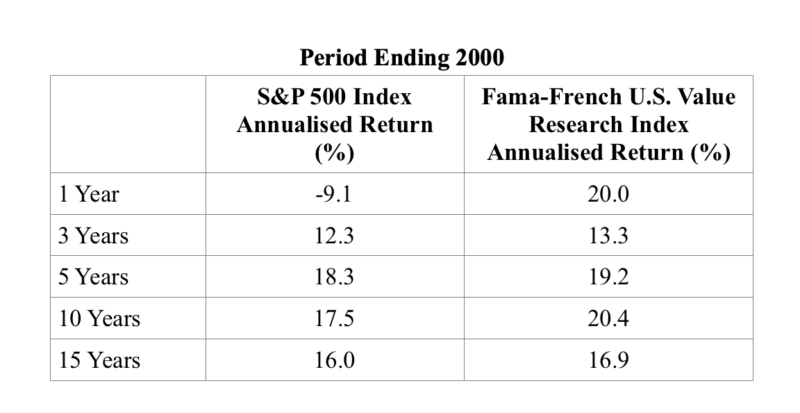
Moving forward just one single year, we find that value stocks now outperformed over each of the periods. The lessons are that there is a lot of volatility in factor performance and that even long periods of underperformance can be reversed over very short time frames. Another lesson is that long periods of underperformance occur in all risky assets. For example, the S&P 500 Index underperformed totally riskless one-month Treasury bills over the 13 years 2000-12, the 15 years 1929-43, and the 17 years 1966-82. It’s also worth noting that over this 17-year period, the S&P 500 Index also underperformed large value stocks by 368 percent and small value stocks by 1,117 percent! Note that the three periods total 45 years, or half of the 90 calendar years since 1929! In each of these periods, value stocks provided diversification benefits, outperforming the S&P 500.
The historical evidence makes clear that all risky assets, not just value stocks, should be expected to go through long periods of underperformance. A problem for investors is that living through such periods is much harder than observing them in the historical data, making it much harder to stay disciplined. Research from Eugene Fama and Ken French show us why it’s so important to stay disciplined.
Investors should expect long periods of underperformance
Eugene Fama and Ken French examined the volatility of the market beta, size and value premiums in their study Volatility Lessons published in the Third Quarter 2018 issue of the Financial Analysts Journal. The study covered the period July 1963 through December 2016. Fama and French noted that while most of the news about equity premium distributions for longer return horizons is good, there is bad news. They used the realised monthly returns from the period their study covered to construct long-horizon simulation returns and found that for the three- and five-year periods that are often the focus of professional investors, negative equity premiums occurred in 29 percent of three-year periods and 23 percent of five-year periods of simulation runs. Even for 10- and 20-year periods, negative premiums occurred in 16 and 8 percent of simulation runs, respectively.
Fama and French found similar results for the size and value premiums and concluded that this is simply the nature of risk — if you want to earn the expected (the mean of the distribution of potential outcomes) premiums, you must accept the fact that you will experience losses, no matter how long your horizon. Said another way, if you can’t stand the heat, get out of the kitchen.
They concluded: “The high volatility of stock returns is common knowledge, but many professional investors seem unaware of its implications. Negative equity premiums and negative premiums of value and small stock returns relative to market are commonplace for three- to five-year periods, and they are far from rare for ten-year periods. Given this uncertainty, investors who will abandon equities or tilts toward value or small stocks in the face of three, five, or even ten years of disappointing returns may be wise to avoid these strategies in the first place.”
Clearly, the returns to all risk assets are not only time varying but can also be expected to experience long periods of underperformance. It’s also why diversification is the logical and prudent strategy, unless of course you have a crystal ball that allows you to know ahead of time which assets will outperform. Because diversification means accepting that some parts of your portfolio will likely experience long periods of poor performance, discipline is key to successful investing. If you don’t know your history and don’t have faith in your strategy, long periods of underperformance will lead to the abandonment of your plan, typically right before returns revert to their long-term mean performance. The historical evidence demonstrates the importance of investors not falling prey to recency bias, which causes the loss of discipline and the abandonment of even well-thought-out plans.
We now turn to reviewing the similarities between 1999 and 2019.
Déjà vu all over again
There are similarities between the most recent period and the period ending in 1999. We’ll begin by noting that the evidence shows that over the long term, companies with negative cash flows have produced negative returns. Data from AQR Capital Management covering the 24-year period 1995-2018 show that there were just five years when such companies produced positive returns, and in only two of those were the returns above a few percent. Those two years were 1999 and 2018. In 1999 companies with negative cash flows returned 19 percent, and in 2018 they returned 6 percent. Similarly, companies with negative earnings produced negative returns in all but seven of those years, and in just two of them were the returns above a nominal percentage.
In 1999, companies with negative earnings returned 27 percent, and in 2018 they returned 8 percent. In both cases, these abnormal/unexpected outcomes contributed to the negative value premium. However, over the long term, companies with these traits do not make for higher-returning investments. In fact, the AQR data shows that over the 24-year period ending in 2018, they have produced negative returns—about -3 percent for companies with negative earnings and about -5 percent for companies with negative cash flow. The performance of companies with negative earnings and cash flow has contributed to the recent underperformance of value stocks. However, just as trees don’t grow to the sky, the historical evidence shows that such anomalies don’t persist. Bubbles eventually burst. We have seen evidence of the anomaly coming to an end with the recent performance of such stocks as Uber Technologies (the stock is now trading at about 33, down from its 52-week high of about 47, a drop of about 30 percent) and Slack Technologies (the stock is now trading at about 21, down from its 52-week high of about 42, a drop of about 50 percent).
Second, in both periods we experienced a bubble in private equity. In most periods we see private companies trading at a discount of about 25 to 30 percent relative to public companies. That discount reflects a liquidity premium. Recently, we have seen several companies that have gone public, or tried to, experience substantial markdowns from their private equity valuations. The most recent example is WeWork. A $2 billion investment from SoftBank in January 2019 valued the co-working company at $47 billion. The company’s attempted IPO failed, even at a much lower valuation. Private equity firm SoftBank announced that it would accelerate a $1.5 billion investment into the company it had committed to making next year. In addition, it would buy up to $3 billion in shares from other investors in WeWork. In return, it would own 80 percent of the company. Note that the historical evidence is that public companies with high investment and poor profitability have had, on average, very poor returns.
Third, in both periods we saw that the spread in valuations between growth and value stocks had moved to well above historical averages. In 1994, right after the publication of the famous Fama-French research on the size and value premiums, the price-to-book (P/B) ratio of U.S. large growth stocks was 2.1 times that of large value stocks. (Data is from Dimensional.) Using the Vanguard Russell 1000 Growth ETF (VONG) and the Vanguard Russell 1000 Value ETF (VONV), we find that as of September 30, 2019, the P/B of VONG was 7.2 and the P/B of VONV was 1.9. The spread was now at 3.8, or about 80 percent wider. We see similar evidence looking at smaller stocks. Using the Vanguard Russell 2000 Growth ETF (VTWG) and the Vanguard Russell 2000 Value ETF (VTWV), we find that as of September 30, 2019, the P/B of VTWG was 3.2 and the P/B of VTWV was 1.2. The spread was now at 2.7, or about 30 percent wider.
The data also helps show that the argument that the value premium has disappeared due to overcrowding is false. If there was overcrowding, the spread would have narrowed, not widened. The spread has widened so much that AQR found that it is now at about the 95th percentile of historical levels. Importantly, the research shows that valuation spreads matter. Internationally and in emerging markets, the valuation spread is at similarly wide historical levels.
Valuations matter
Adam Zaremba and Mehmet Umutlu, authors of the March 2019 study Strategies Can Be Expensive Too! The Value Spread and Asset Allocation in Global Equity Markets, examined whether the value spread (the difference in valuation ratios between the long and the short sides of the trade) was useful for forecasting returns on quantitative equity strategies for country selection. To test this, they examined a sample of 120 country-level equity strategies replicated within 72 stock markets for the years 1996 through 2017.
They found: “The breadth of the value spread can predict the future returns in the cross-section. We show that equity strategies with a wide value spread markedly outperform strategies with a narrow value spread. In other words, if you wonder which strategy might produce decent payoffs in the future, pay attention to the value spread.”
Their findings are consistent with prior research. For example, the June 2018 study Value Timing: Risk and Return Across Asset Classes by Fahiz Baba Yara, Martijn Boons and Andrea Tamoni also found that valuation spreads provide information. The authors demonstrated that “returns to value strategies in individual equities, commodities, currencies, global government bonds and stock indexes are predictable by the value spread. … In all asset classes, a standard deviation increase in the value spread predicts an increase in expected value return in the same order of magnitude (or more) as the unconditional value premium.”
Jim Davis’ 2007 study Does Predicting the Value Premium Earn Abnormal Returns? also found that book-to-market ratio spreads contain information regarding future returns. However, he also found that style-timing rules did not generate high average returns because the signals are “too noisy” — they don’t provide enough information to offer a profitable timing signal. Confirming Davis’ findings, AQR’s research into style-timing rules led them to conclude that they increase turnover and trading costs, making them even less effective for implementation.
Before closing, the following words of caution are offered: Remember that cheap stocks can get cheaper, and more expensive stocks can get even more expensive. Recall Federal Reserve Chairman Alan Greenspan’s famous December 1996 observation that the market was irrationally exuberant. The market ignored him for another three plus years before the bubble finally burst. In other words, we don’t know when the recent trend will reverse. Patience and discipline are required.
Summary
Failing conventionally (owning a market-like portfolio) is always easier than failing unconventionally (such as tilting to value stocks or small stocks) because “misery loves company”. However, the historical evidence demonstrates that diversifying across factors that have shown persistence, pervasiveness, robustness, survive transactions costs and have risk-based or behavioral-based explanations for why their historical premium should persist is more likely to lead to achieving financial goals. However, it does mean having to live with the fact that your portfolio will perform differently than traditional portfolios, creating the risk of tracking variance regret. In that sense, diversification is not a free lunch. It means living through uncomfortable periods, even long ones. And during periods of failure, it means failing unconventionally, which is much harder for many investors to deal with.
The following table, which covers the period 1927 through 2018, shows the historical odds of a negative premium for the three factors of market beta, size and value. (Data is again from the Fama/French Data Library.)
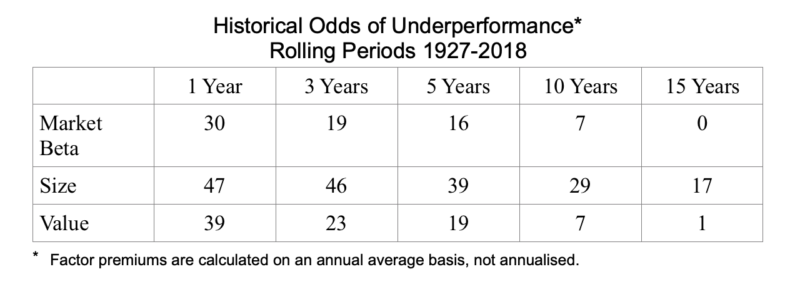
As you view the results you should notice:
— No matter the horizon, just as stocks are likely to outperform safe one-month Treasury bills, value stocks are likely to outperform growth stocks.
— Each of the three risk factors is likely to experience extended periods of underperformance. Thus, even underperformance of ten or 15 years should be considered noise.
— The longer the horizon, the lower the odds of underperformance for each of the factors.
— The odds of the value premium being negative have been quite similar to the odds that market beta has been negative.
The historical evidence makes clear that whichever path you choose, you will have to live through uncomfortable times. Thus, it seems logical that you should choose the path that gives you the highest odds of achieving your goals. And that is choosing the more efficient portfolio — the more diversified one — and saying, “I don’t give a damn about tracking variance regret because relativism [how you performed relative to some popular index] has no place in investing.”
On the other hand, if you believe or find that you cannot deal with tracking variance, you should own a more market-like portfolio because discipline (sticking to your plan) is more important than having the “right” plan. The reason is that no plan is likely to succeed if you cannot stick with it because you will likely end up selling assets after periods of poor performance (at low valuations and thus high future expected returns) and buying assets after periods of strong performance (at high valuations and low future expected returns).
Buying high and selling low is not a recipe for success. It’s also why so many individual investors, and even institutional investors, underperform the very funds in which they invest.
LARRY SWEDROE is Chief Research Officer at Buckingham Strategic Wealth and the author of 17 books on investing, including Think, Act, and Invest Like Warren Buffett.
Some of Larry’s other articles include:
Third quarter 2019 hedge fund performance update
Sequence risk is a big threat to retirees
The facts on active share and outperformance
How interest rates affect risk taking
Do yield curve inversions tell us anything useful?


