Anyone who invests in equities has to be prepared for significant short-term losses. As Jack Bogle once put it, ”if you have trouble imagining a 20% loss in the stock market, you shouldn’t be in stocks.”
The market falls we saw at the start of the coronavirus crisis certainly tested investors’ appetite for risk. At one stage, the S&P 500 was down 30.7% on the level it started the year at.
At the time of writing it’s down a more manageable 12.7% year to date. But who knows where the market will go from here? Perhaps we’re just at the start of a long and protracted bear market.
A good question to ask, whenever you’re worried about something, is “What’s the worst that could happen?” So, if stocks do start falling again, how much could you lose?
NICK MAGGIULLI, a data scientist at Ritholtz Wealth Management, has been looking back through history at how far markets have fallen in the past.
Earlier this year I wrote about why market timing can be so appealing to investors. The key takeaway was that if you bought the Dow on a random day, there was a 95% chance that the index would be lower at some point in the future.
This implied that you could’ve gotten a better price 95% of the time if you waited (and knew the future). However, it also implied that nearly every time you buy the index, you are basically guaranteed to see your position lose money at some point in time.
But, the better question is: how much could you lose?
If you bought the Dow on a random day, what is the probability of being down 10% in the future? What about being down 20%? What about 30%?
This post will address these questions to help you set expectations concerning future losses.
To start, I want to revisit a concept called the “low watermark” from my prior post on market timing. A low watermark is simply the lowest price that an index will be at in the future.
So, if we plotted the Dow index (price only) with its low watermark from 1915 until the recent coronavirus low on March 23, 2020, it would look something like this (note: y-axis is a log scale):
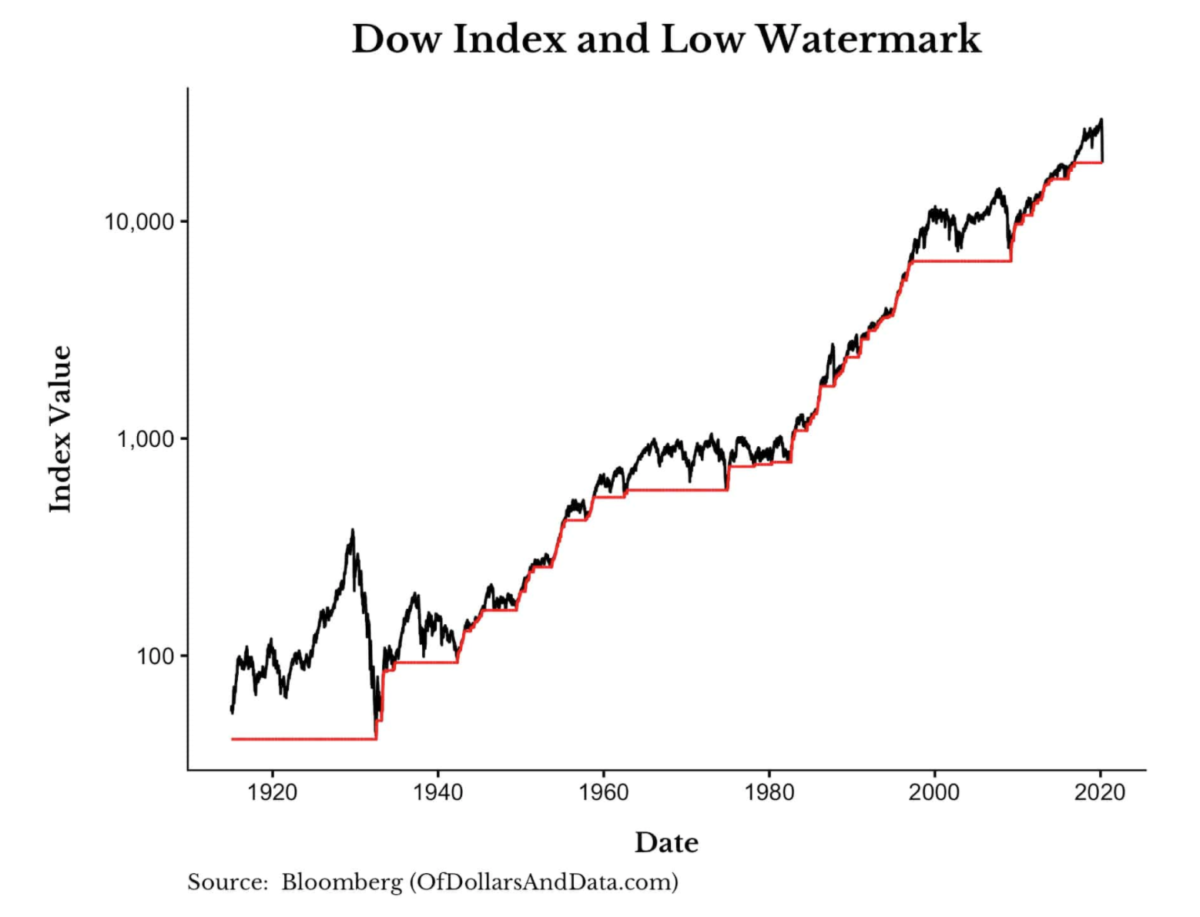
As you can see, the low watermark was flat from 1915 until the summer of 1932 when the Great Depression hit its bottom. In more modern times, you can see the low watermark for the Great Recession in March 2009 extending backward to the 1990s.
Why is the low watermark important? Because it tells us how much the Dow will lose at any point in time into the future.
So, if we took each index value and calculated the loss it would experience upon reaching its future low, it would look something like this:
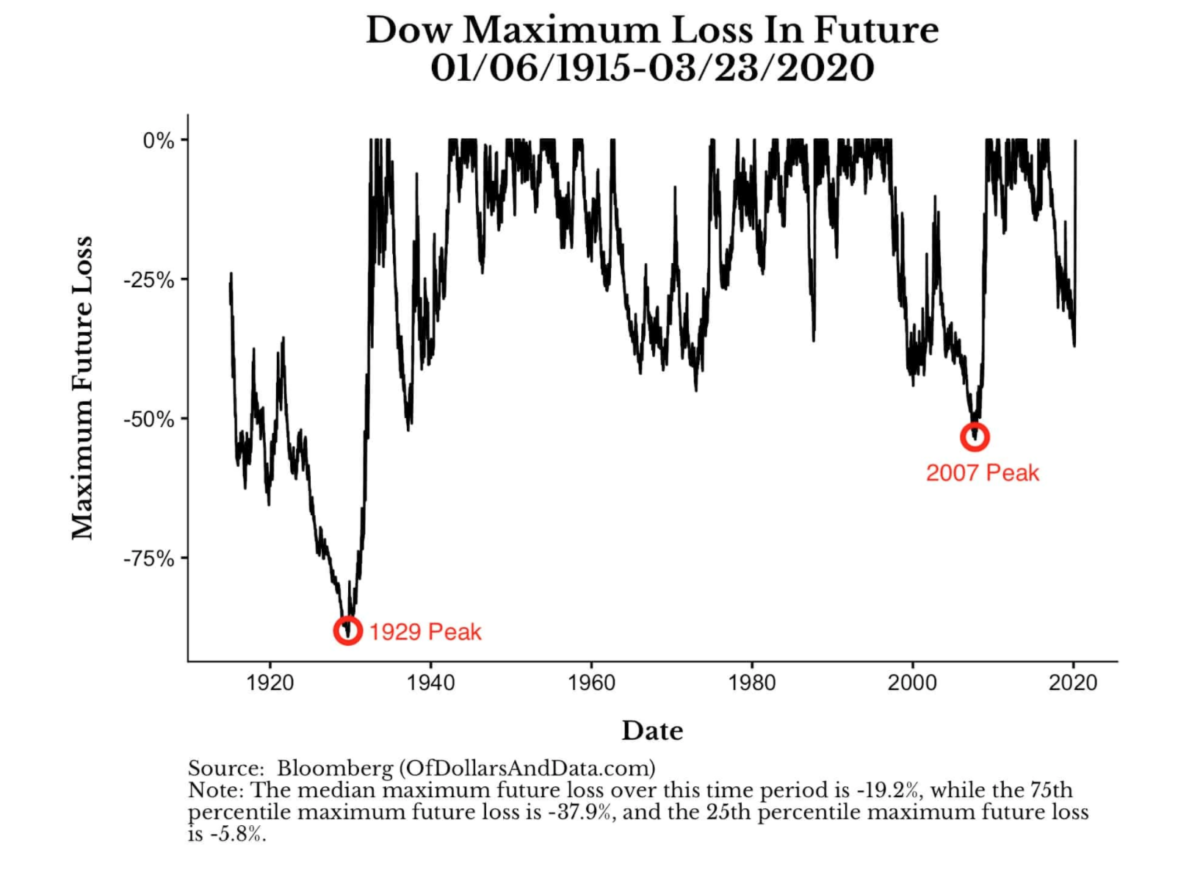
I have highlighted two market peaks in particular to illustrate how to think about this chart. For example, from the 1929 peak to the bottom in 1932, the loss experienced was 89%. From the 2007 peak to the March 2009 bottom, the loss was 54%.
More importantly though, the median “maximum future loss” over this time period is -19.2%. This means that if you had bought the Dow on a random day from 1915 until now, there would have been a 50% chance of losing 19.2% or less in the future.
Using the additional summary statistics from the “Note:” we can see that there was a 25% chance of losing 5.8% or less and a 25% chance of losing 37.9% or more when selecting a random day.
Unfortunately, this data is heavily skewed by the Great Depression. If we remove the Great Depression and start in 1950, we can see that the median “maximum future loss” drops from 19.2% to only 13.2%:
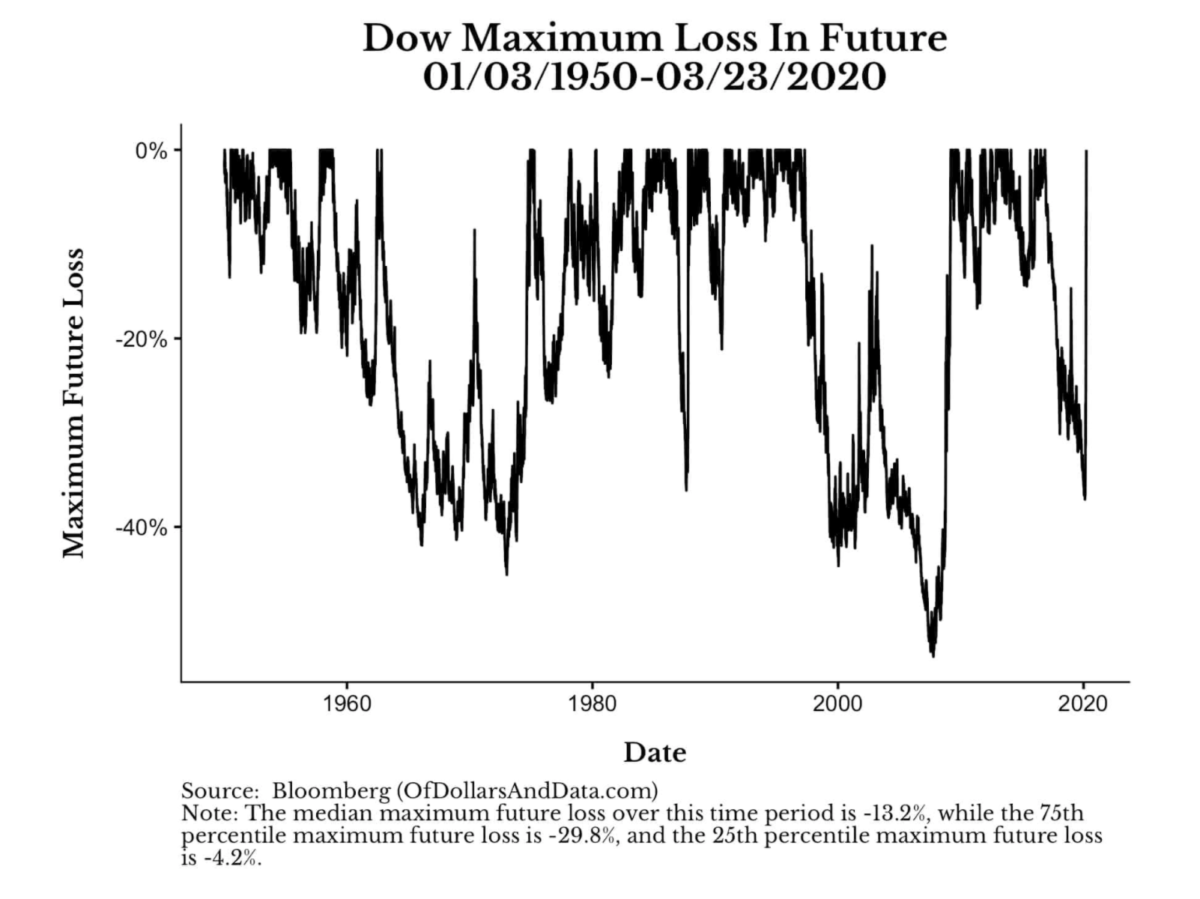
This means that half the time you will lose 13.2% or less and half the time you will lose 13.2% or more. In addition, there is a 1 in 4 chance of losing 29.8% or more and a 1 in 4 chance of losing 4.2% or less.
Putting it altogether, we can create a chart that shows, for a given level of decline or greater, what is the probability of its occurrence:
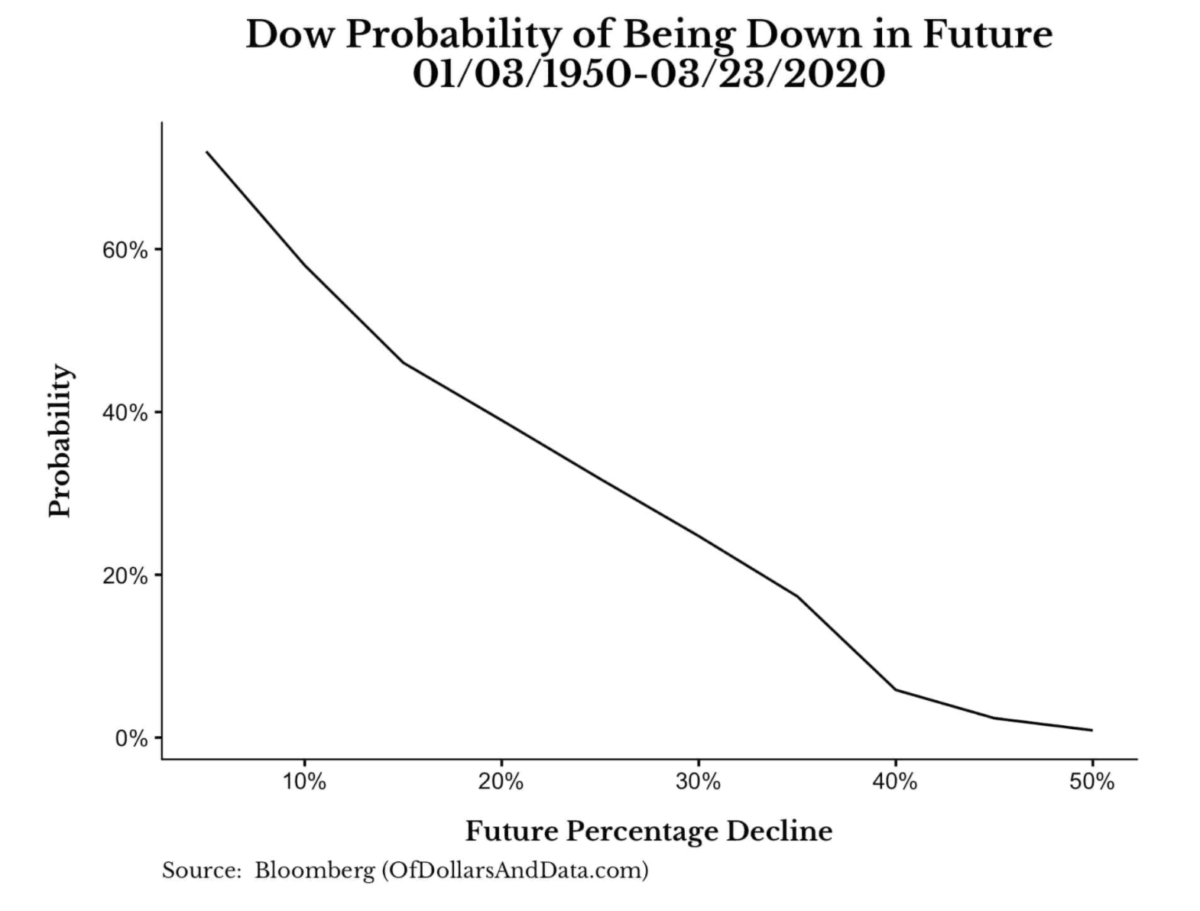
So if we want to know the probability of seeing a 10% decline or greater, consult the chart and see that the answer is 60%.
The chance of seeing a 20% future decline or greater? 40%. A 30% decline or greater? 25%.
You get the point.
Of course, this chart is only as good as the historical data that is fed into it. If we have a decline (or multiple declines) much greater than 50% then the chart will need to be updated to reflect these.
Nevertheless, my point isn’t to be perfect, but to set expectations. While market history can never tell us about the future, it can be used to set proper expectations.
And, for equities, you should expect to see a 50%+ price decline a couple times a century, a 30% decline once a generation, and a 10% price decline at least every other year.
Some markets will behave worse and some will behave better, but this is the price of admission.
But don’t just take it from me though. The Oracle of Omaha Warren Buffett made similar remarks at his most recent online meeting for Berkshire Hathaway shareholders:
“I pointed out that there have been three times in Berkshire’s history when the price of Berkshire’s stock went down 50%. Three different times. Now, if you owned it on borrowed money, you could’ve been cleaned out. There wasn’t anything wrong with Berkshire when those three times occurred…”
Buffett admits that these kind of losses are a natural part of the process. They aren’t anyone’s fault. They just happen. So, if the world’s greatest investor expects his equity portfolio to get cut in half periodically, why wouldn’t you?
The privilege of being prepared
Even if you have accepted the sizeable losses that your equity portfolio is destined to face in the future, how do you deal with these losses psychologically?
My best piece of advice is to be prepared. Having ample emergency savings and alternate sources of income are the best ways to weather a market crash.
Yes, I understand how privileged it is to say these things, how privileged it is to be able to prepare. I understand the luxury of having job security and a great education to fall back on. However, this doesn’t mean that my advice isn’t useful.
The only way that I was able to watch my portfolio decline by 28% without blinking an eye was because I prepared. I’ve been preparing for years. Not for this exact situation, but something like it.
And I know how crazy that sounds before the fact, but avoiding negative outcomes is my speciality.
So you can either heed my advice or not. Do your homework or not. Make the right financial choices or not.
After all, how much could you lose?
This article first appeared on NICK MAGGIULLI’s excellent blog, Of Dollars and Data, and is republished here with his kind permission.
Here are some other articles about the impact of the coronavirus crisis on the markets that we’ve published here on TEBI in recent weeks:
What if the doom mongers are right?
What previous market crashes teach us about this one
How did UK active managers fare in the market rout?
How worried should investors be about a recession?
The economy and the stock market are not the same
Are markets still rational, even in a crash?
Will the optimists triumph again?
Remember, you’ve trained for this
Stay the Course: our crisis survival kit for advisers
Picture: Edwin Hooper via Unsplash


