By BEN LEALE-GREEN
Does the S&P 500® receive a premium over the S&P 500 ESG Index? Absent a premium from the S&P 500, investors could have their cake and eat it too with the S&P 500 ESG Index: similar or better performance, along with the benefits of ESG.
Academic literature suggests no sin stock premium over their non-sin counterparts. Sin stocks are usually defined by their product involvement (e.g., tobacco, controversial weapons, etc.). “The Price of Sin”[1] explored apparent outperformance of sin stocks, citing theories of neglected stocks and segmented markets. When adding sector controls to factors while ensuring the sin stock indices assessed are market-cap weighted[2] and evolving asset pricing models to include quality and low volatility factors,[3] a lack of sin premia was observed.
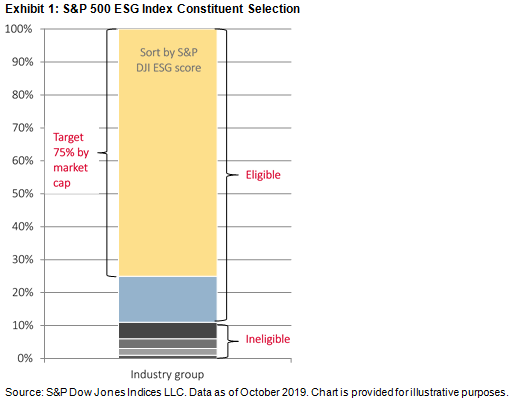
While the S&P 500 ESG Index does exclude some sin stocks, it also takes a more holistic view of ESG and removes the worst ESG companies, as measured by the S&P DJI ESG Scores.[4] Exhibit 1 displays the selection process for the S&P ESG Index Series.
The S&P 500 ESG Index is designed in alignment with the S&P 500’s risk/return profile, while removing the worst ESG performers. It seeks to provide greater exposure to companies that, for example:
Limit scope 3 GHG emissions and set targets for reduction;
Actively monitor diversity-related issues;
Have at least 50% female management representation
Include performance and reporting on their ESG materiality analysis; and
Tie executive compensation to material ESG issues.
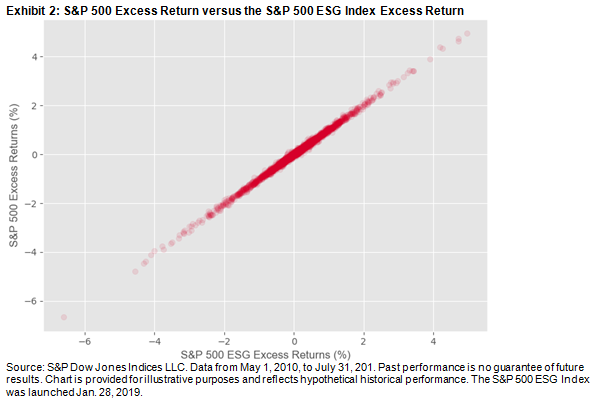
Exhibit 2 shows the excess return over the risk-free rate for the S&P 500 ESG Index and the S&P 500, and it can be observed that the excess returns are similar. Furthermore, the tracking error over this period was 0.93% (which was even lower over the past five years, at 0.74%[5]). The annualised volatility of the S&P 500 ESG Index was slightly lower than the S&P 500, at 14.63% and 14.86%, respectively. The annualised return was 0.02% higher for the S&P 500 ESG Index than the S&P 500.
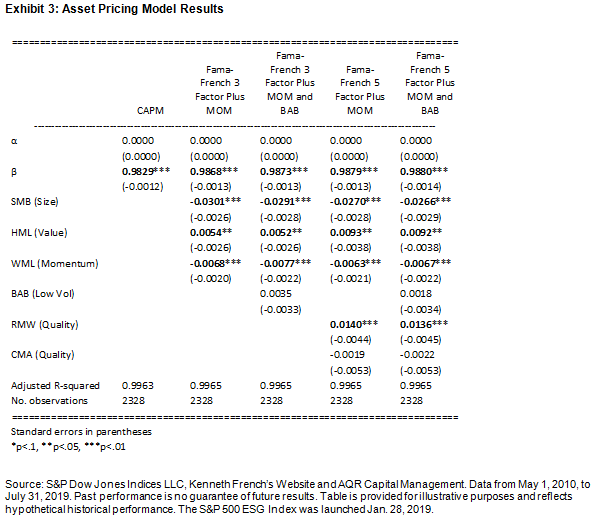
Following Blitz and Fabozzi’s approach,[6] the Capital Asset Pricing Model and its derivatives[7], which include factors assessing relative size, value, momentum, low volatility, and quality[8]. The S&P 500 excess return was used as the market risk premium to assess alpha (α) of the S&P 500 ESG Index.
For each model implemented, there is insignificant alpha present (see Exhibit 3), thus no significant out- or underperformance of the S&P 500 ESG Index compared with the S&P 500 during this period.
As the returns of the S&P 500 ESG Index are so close to those of the S&P 500, plus the opportunity to receive all the ESG benefits, why not choose the former over its market-cap-weighted parent?
References:
[1] Hong, H., & Kacperczyk, M. (2009). The Price of Sin: The Effects of Social Norms on Markets. Journal of Financial Economics, 15-36.
[2] Adamsson, H., & Hoepner, A. (2015). The ‘Price of Sin’ Aversion: Ivory Tower Illusion or Real Investable Alpha?
[3] Blitz, D., & Fabozzi, F. (2017). Sin Stocks Revisited: Resolving the Sin Stock Anomaly. Journal of Portfolio Management, 82-94.
[4] Please see the S&P 500 ESG Index methodology for more information.
[5] Source: S&P Dow Jones Indices LLC. Performance data from May 31, 2014, to May 31, 2019.
[6] Blitz, D., & Fabozzi, F. (2017). Sin Stocks Revisited: Resolving The Sin Stock Anomaly. Journal of Portfolio Management, 82-94.
[7] French, K. F. (1992). The cross-section of expected stock returns. Journal of Finance, 427-465; French, K., & Fama, E. (2015). A Five-Factor Asset Pricing Model. Journal of Financial Economics, 1-22; Carhart, M. (1997). On Persistence in Mutual Fund Performance. The Journal of Finance, 57-82; Frazzini, A., & Pedersen, L. (2013). Betting Against Beta. Journal of Financial Economics, 1-25.
[8] These models have been run using data from May 1, 2010, the start of the S&P 500 ESG Index’s back-tested history, through July 31, 2019, the most recent date for which the factor returns are available, using daily returns. The index levels are sourced from S&P Dow Jones Indices LLC, while the factor returns are sourced from Kenneth French’s website (French, K. [September 2019]. Current Research Returns. (French K. , Current Research Returns, 2019) and AQR (AQR. (2019, September). Betting Against Beta: Equity Factors, Daily. https://www.aqr.com/Insights/Datasets/Betting-Against-Beta-Equity-Factors-Daily)
BEN LEALE-GREEN is an analyst, responsible for ESG Research & Design at S&P Dow Jones Indices.
This article was first posted on the Indexology Blog and is republished here with the kind permission of S&P Dow Jones Indices.
Interested in reading more about sustainable investing? Here are a few more articles from this series:
We need to make modern slavery unsustainable
Europe’s sustainable funds universe continues to grow
A tipping point in attitudes to climate change?
Does shareholder activism make a positive difference?
Can the UK become a global champion in impact investing?
ShareAction: Why we’re offering free training to shareholder activists